|
SNAP Library 6.0, Developer Reference
2020-12-09 16:24:20
SNAP, a general purpose, high performance system for analysis and manipulation of large networks
|
|
SNAP Library 6.0, Developer Reference
2020-12-09 16:24:20
SNAP, a general purpose, high performance system for analysis and manipulation of large networks
|
#include <gnuplot.h>
Classes | |
| class | TGpSeries |
| class | TGpSeriesCmp |
Public Member Functions | |
| TStr | GetSeriesPlotStr (const int &PlotN) |
| int | IsSameXCol (const int &CurId, const int &PrevId) const |
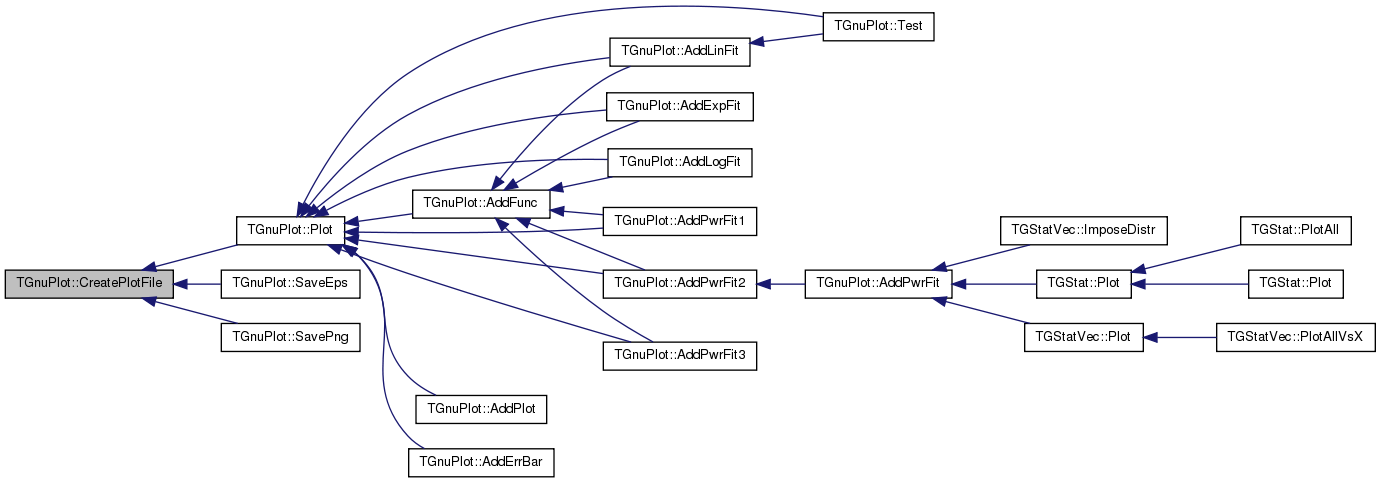
| void | CreatePlotFile (const TStr &Comment=TStr()) |
| void | RunGnuPlot () const |
| TGnuPlot (const TStr &FileNm="gplot", const TStr &PlotTitle=TStr(), const bool &Grid=true) | |
| TGnuPlot (const TStr &DataFileNm, const TStr &PlotFileNm, const TStr &PlotTitle, const bool &Grid) | |
| TGnuPlot (const TGnuPlot &GnuPlot) | |
| TGnuPlot & | operator= (const TGnuPlot &GnuPlot) |
| void | SetTitle (const TStr &PlotTitle) |
| void | SetXLabel (const TStr &XLabel) |
| void | SetYLabel (const TStr &YLabel) |
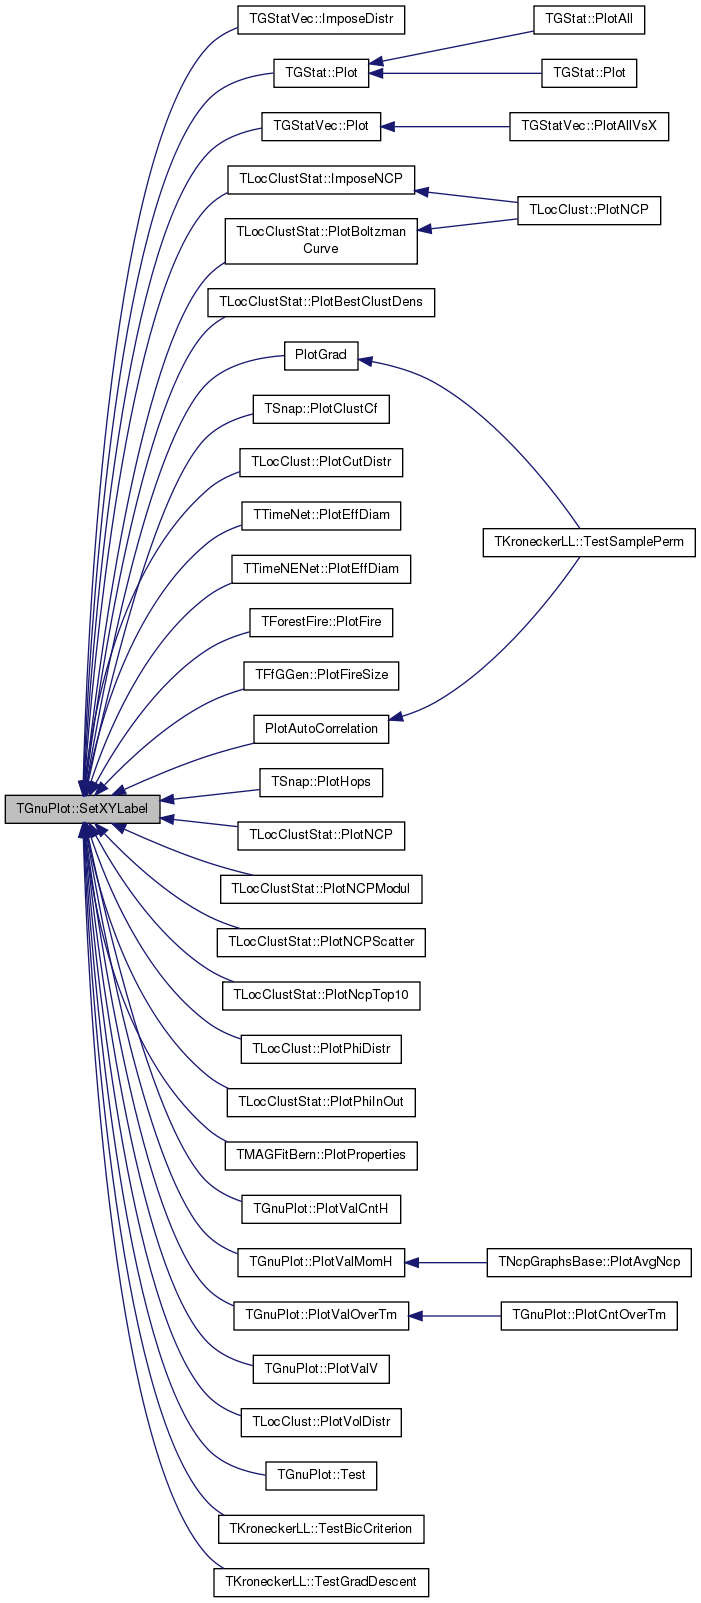
| void | SetXYLabel (const TStr &XLabel, const TStr &YLabel) |
| void | SetDataPlotFNm (const TStr &DatFNm, const TStr &PltFNm) |
| void | ShowGrid (const bool &Show) |
| void | Pause (const bool &DoPause) |
| void | SetScale (const TGpScaleTy &GpScaleTy) |
| void | SetXRange (const double &Min, const double &Max) |
| void | SetYRange (const double &Min, const double &Max) |
| void | AddCmd (const TStr &Cmd) |
| TStr | GetLineStyle (const int &PlotId) const |
| void | SetLineStyle (const int &PlotId, const TStr &StyleStr) |
| int | AddFunc (const TStr &FuncStr, const TGpSeriesTy &SeriesTy=gpwLinesPoints, const TStr &Label=TStr(), const TStr &Style=TStr()) |
| int | AddPlot (const TIntV &YValV, const TGpSeriesTy &SeriesTy=gpwLinesPoints, const TStr &Label=TStr(), const TStr &Style=TStr()) |
| int | AddPlot (const TFltV &YValV, const TGpSeriesTy &SeriesTy=gpwLinesPoints, const TStr &Label=TStr(), const TStr &Style=TStr()) |
| int | AddPlot (const TFltV &XValV, const TFltV &YValV, const TGpSeriesTy &SeriesTy=gpwLinesPoints, const TStr &Label=TStr(), const TStr &Style=TStr()) |
| int | AddPlot (const TIntPrV &XYValV, const TGpSeriesTy &SeriesTy=gpwLinesPoints, const TStr &Label=TStr(), const TStr &Style=TStr()) |
| int | AddPlot (const TFltPrV &XYValV, const TGpSeriesTy &SeriesTy=gpwLinesPoints, const TStr &Label=TStr(), const TStr &Style=TStr()) |
| int | AddPlot (const TIntKdV &XYValV, const TGpSeriesTy &SeriesTy=gpwLinesPoints, const TStr &Label=TStr(), const TStr &Style=TStr()) |
| int | AddPlot (const TFltKdV &XYValV, const TGpSeriesTy &SeriesTy=gpwLinesPoints, const TStr &Label=TStr(), const TStr &Style=TStr()) |
| int | AddPlot (const TIntFltKdV &XYValV, const TGpSeriesTy &SeriesTy=gpwLinesPoints, const TStr &Label=TStr(), const TStr &Style=TStr()) |
| int | AddPlot (const TIntFltPrV &XYValV, const TGpSeriesTy &SeriesTy=gpwLinesPoints, const TStr &Label=TStr(), const TStr &Style=TStr()) |
| int | AddPlot (const TStr &DataFNm, const int &ColY, const TGpSeriesTy &SeriesTy=gpwLinesPoints, const TStr &Label=TStr(), const TStr &Style=TStr()) |
| int | AddPlot (const TStr &DataFNm, const int &ColX, const int &ColY, const TGpSeriesTy &SeriesTy=gpwLinesPoints, const TStr &Label=TStr(), const TStr &Style=TStr()) |
| template<class TKey , class TDat , class THashFunc > | |
| int | AddPlot (const THash< TKey, TDat, THashFunc > &XYValH, const TGpSeriesTy &SeriesTy=gpwLinesPoints, const TStr &Label=TStr(), const TStr &Style=TStr(), const bool &ExpBucket=false) |
| template<class TKey , class THashFunc > | |
| int | AddPlot (const THash< TKey, TMom, THashFunc > &ValMomH, const TGpSeriesTy &SeriesTy=gpwLinesPoints, const TStr &Label=TStr(), const TStr &Style=TStr(), bool PlotAvg=true, bool PlotMed=true, bool PlotMin=false, bool PlotMax=false, bool PlotSDev=false, bool PlotStdErr=false, const bool &ExpBucket=false) |
| int | AddErrBar (const TFltTrV &XYDValV, const TStr &Label=TStr()) |
| int | AddErrBar (const TFltTrV &XYDValV, const TStr &DatLabel, const TStr &ErrLabel) |
| int | AddErrBar (const TFltV &YValV, const TFltV &DeltaYV, const TStr &Label=TStr()) |
| int | AddErrBar (const TFltV &XValV, const TFltV &YValV, const TFltV &DeltaYV, const TStr &Label=TStr()) |
| int | AddErrBar (const TFltPrV &XYValV, const TFltV &DeltaYV, const TStr &Label=TStr()) |
| int | AddErrBar (const TFltKdV &XYValV, const TFltV &DeltaYV, const TStr &Label=TStr()) |
| int | AddErrBar (const TFltPrV &XYValV, const TFltV &DeltaYV, const TStr &DatLabel, const TStr &ErrLabel) |
| int | AddLinFit (const int &PlotId, const TGpSeriesTy &SeriesTy=gpwLines, const TStr &Style=TStr()) |
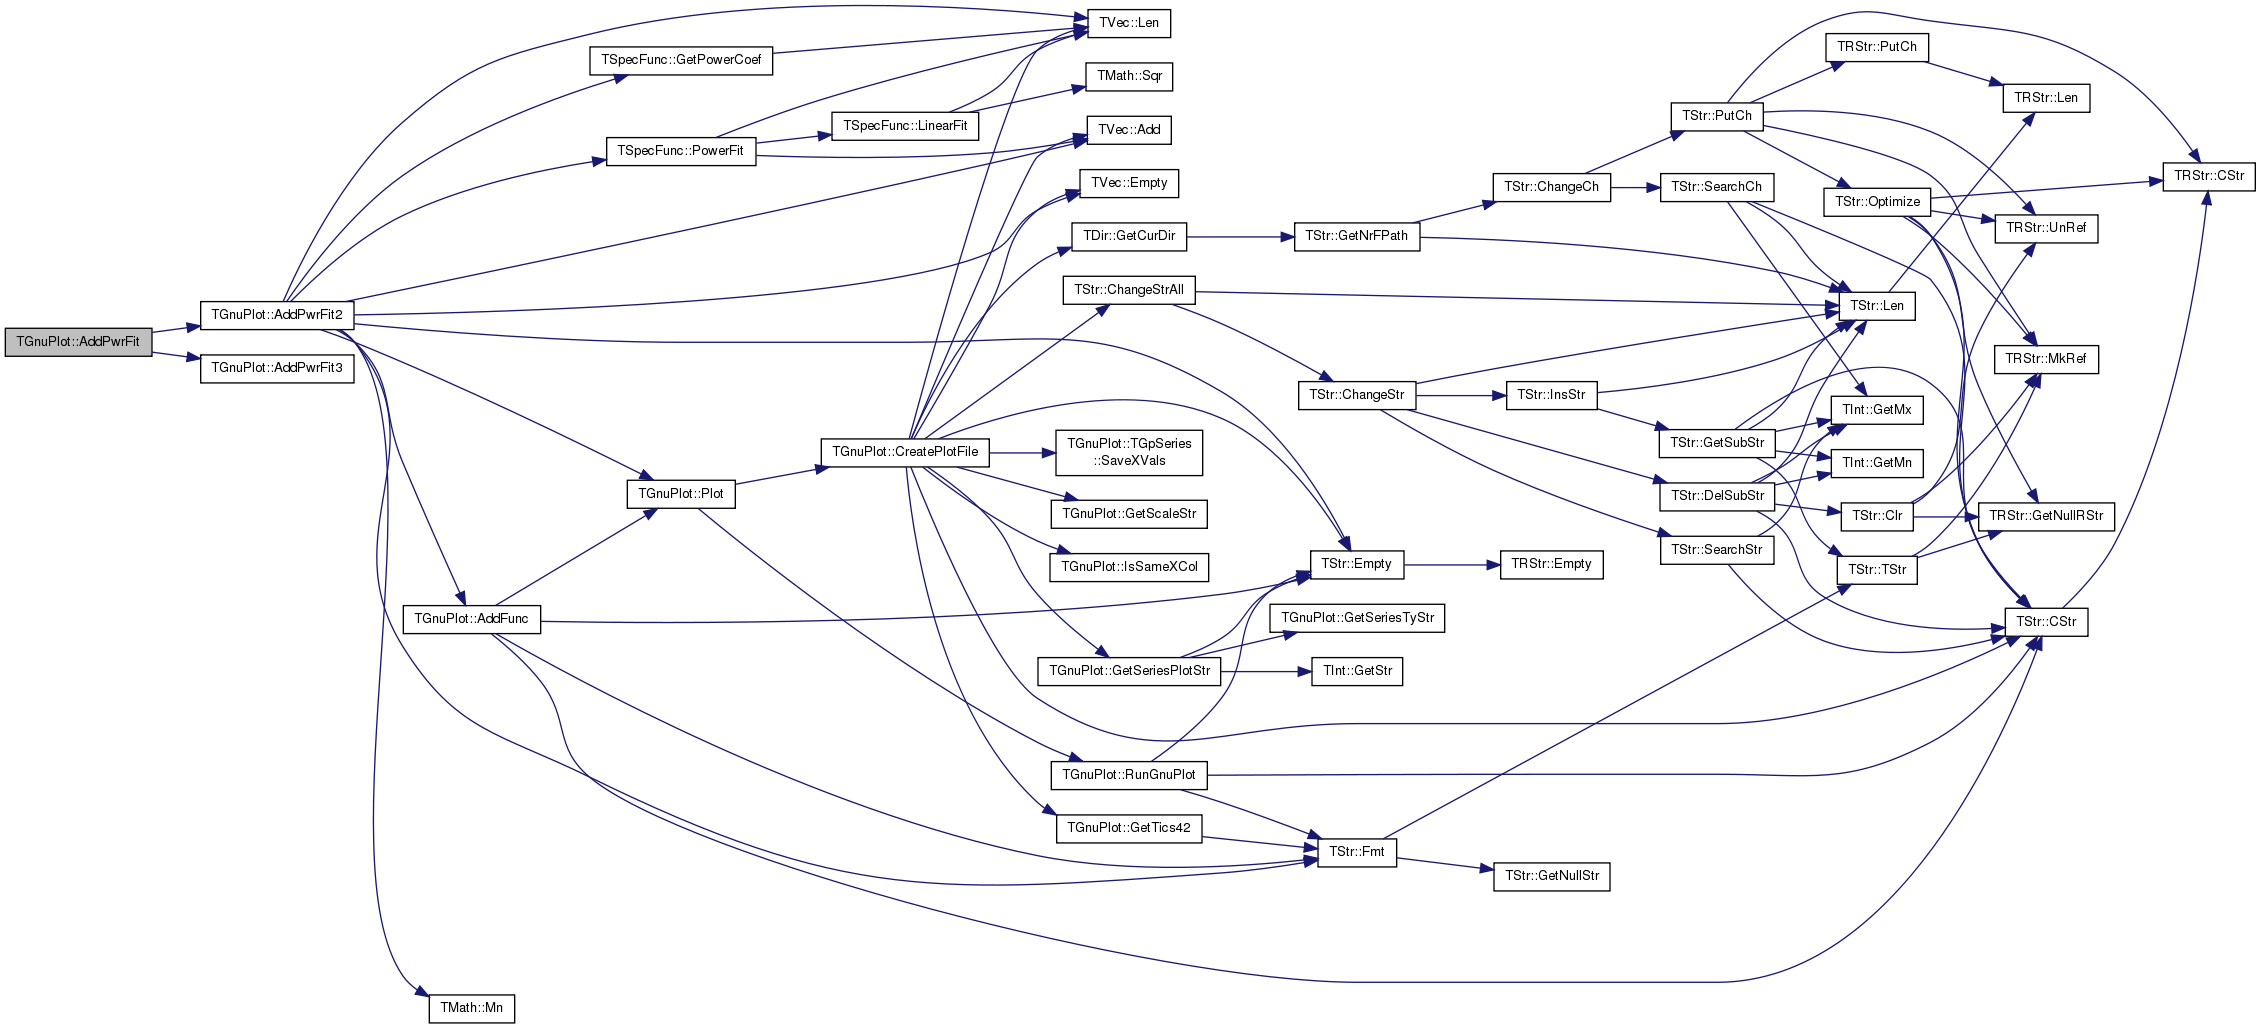
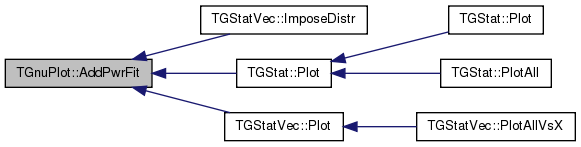
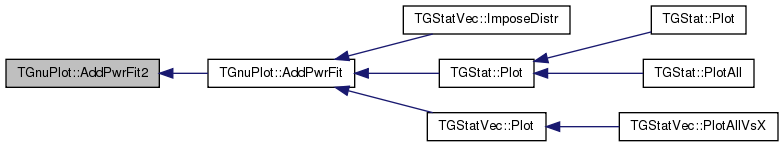
| int | AddPwrFit (const int &PlotId, const TGpSeriesTy &SeriesTy=gpwLines, const TStr &Style=TStr()) |
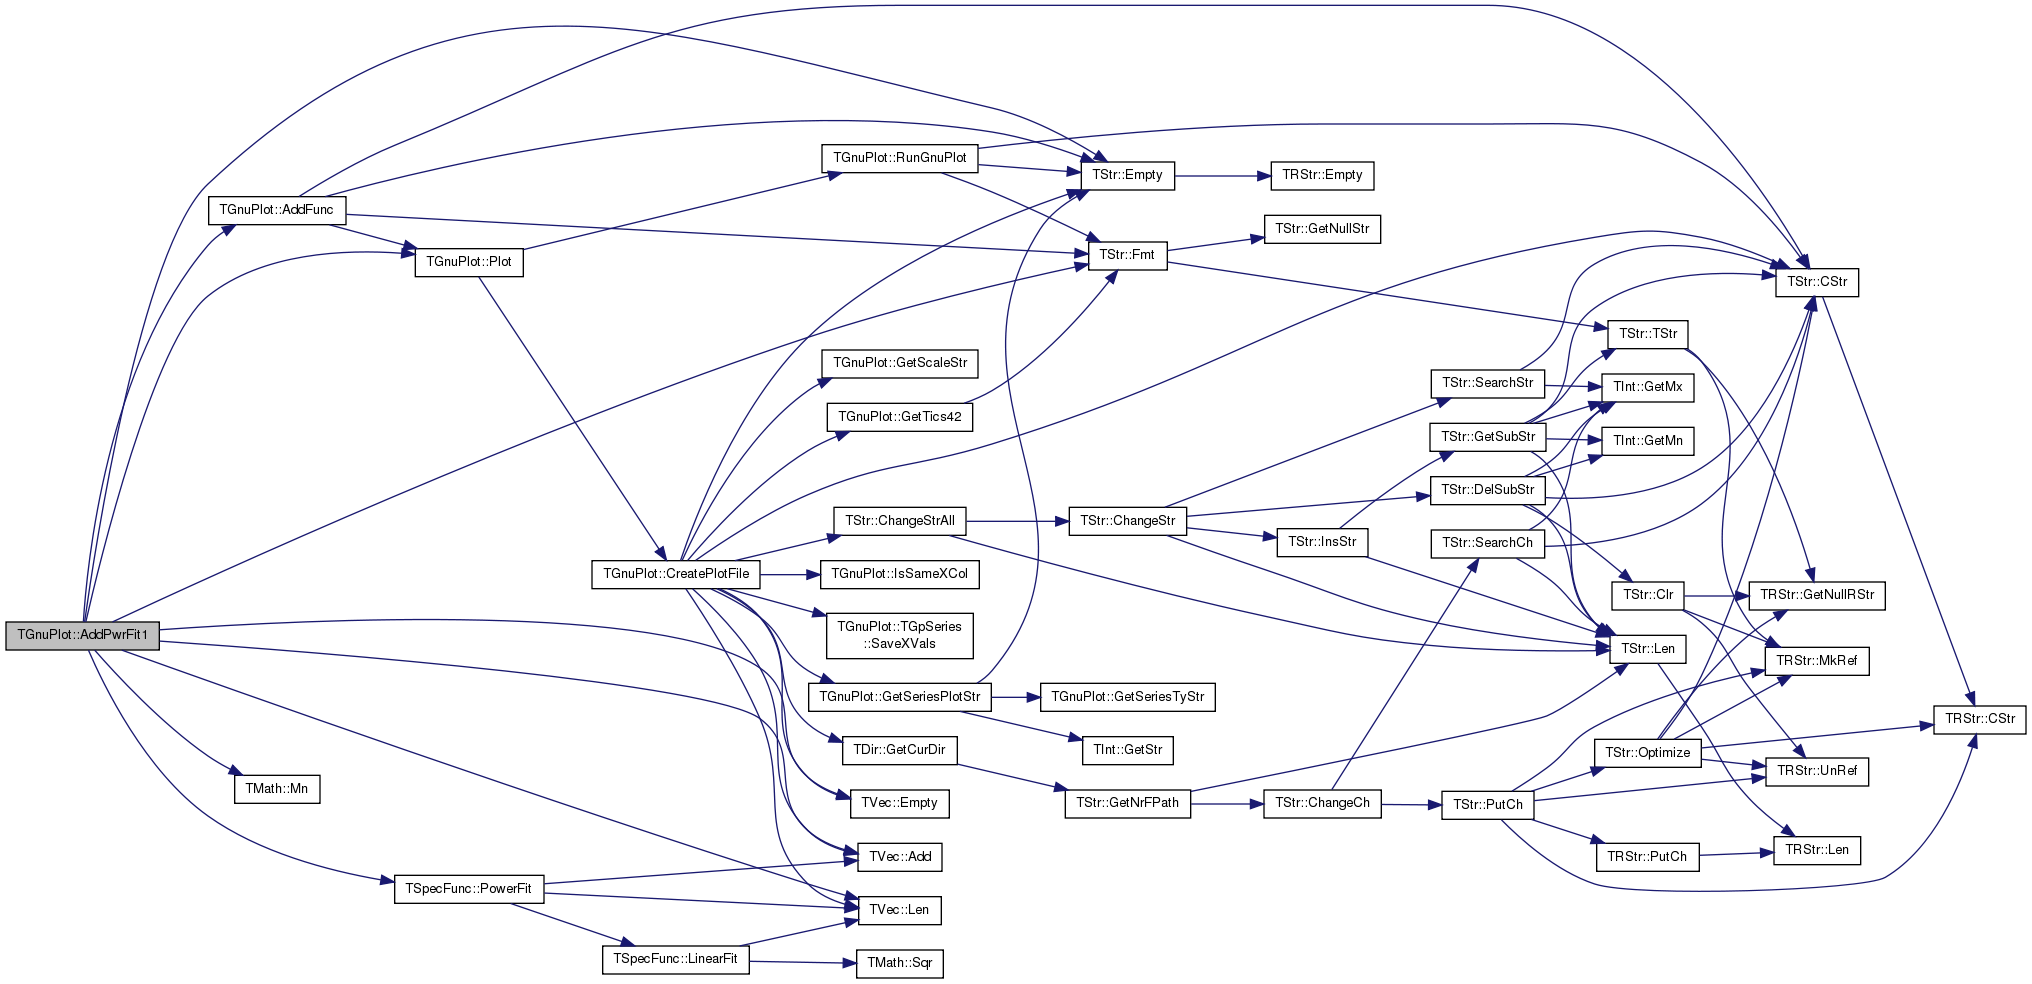
| int | AddPwrFit1 (const int &PlotId, const TGpSeriesTy &SeriesTy=gpwLines, const TStr &Style=TStr()) |
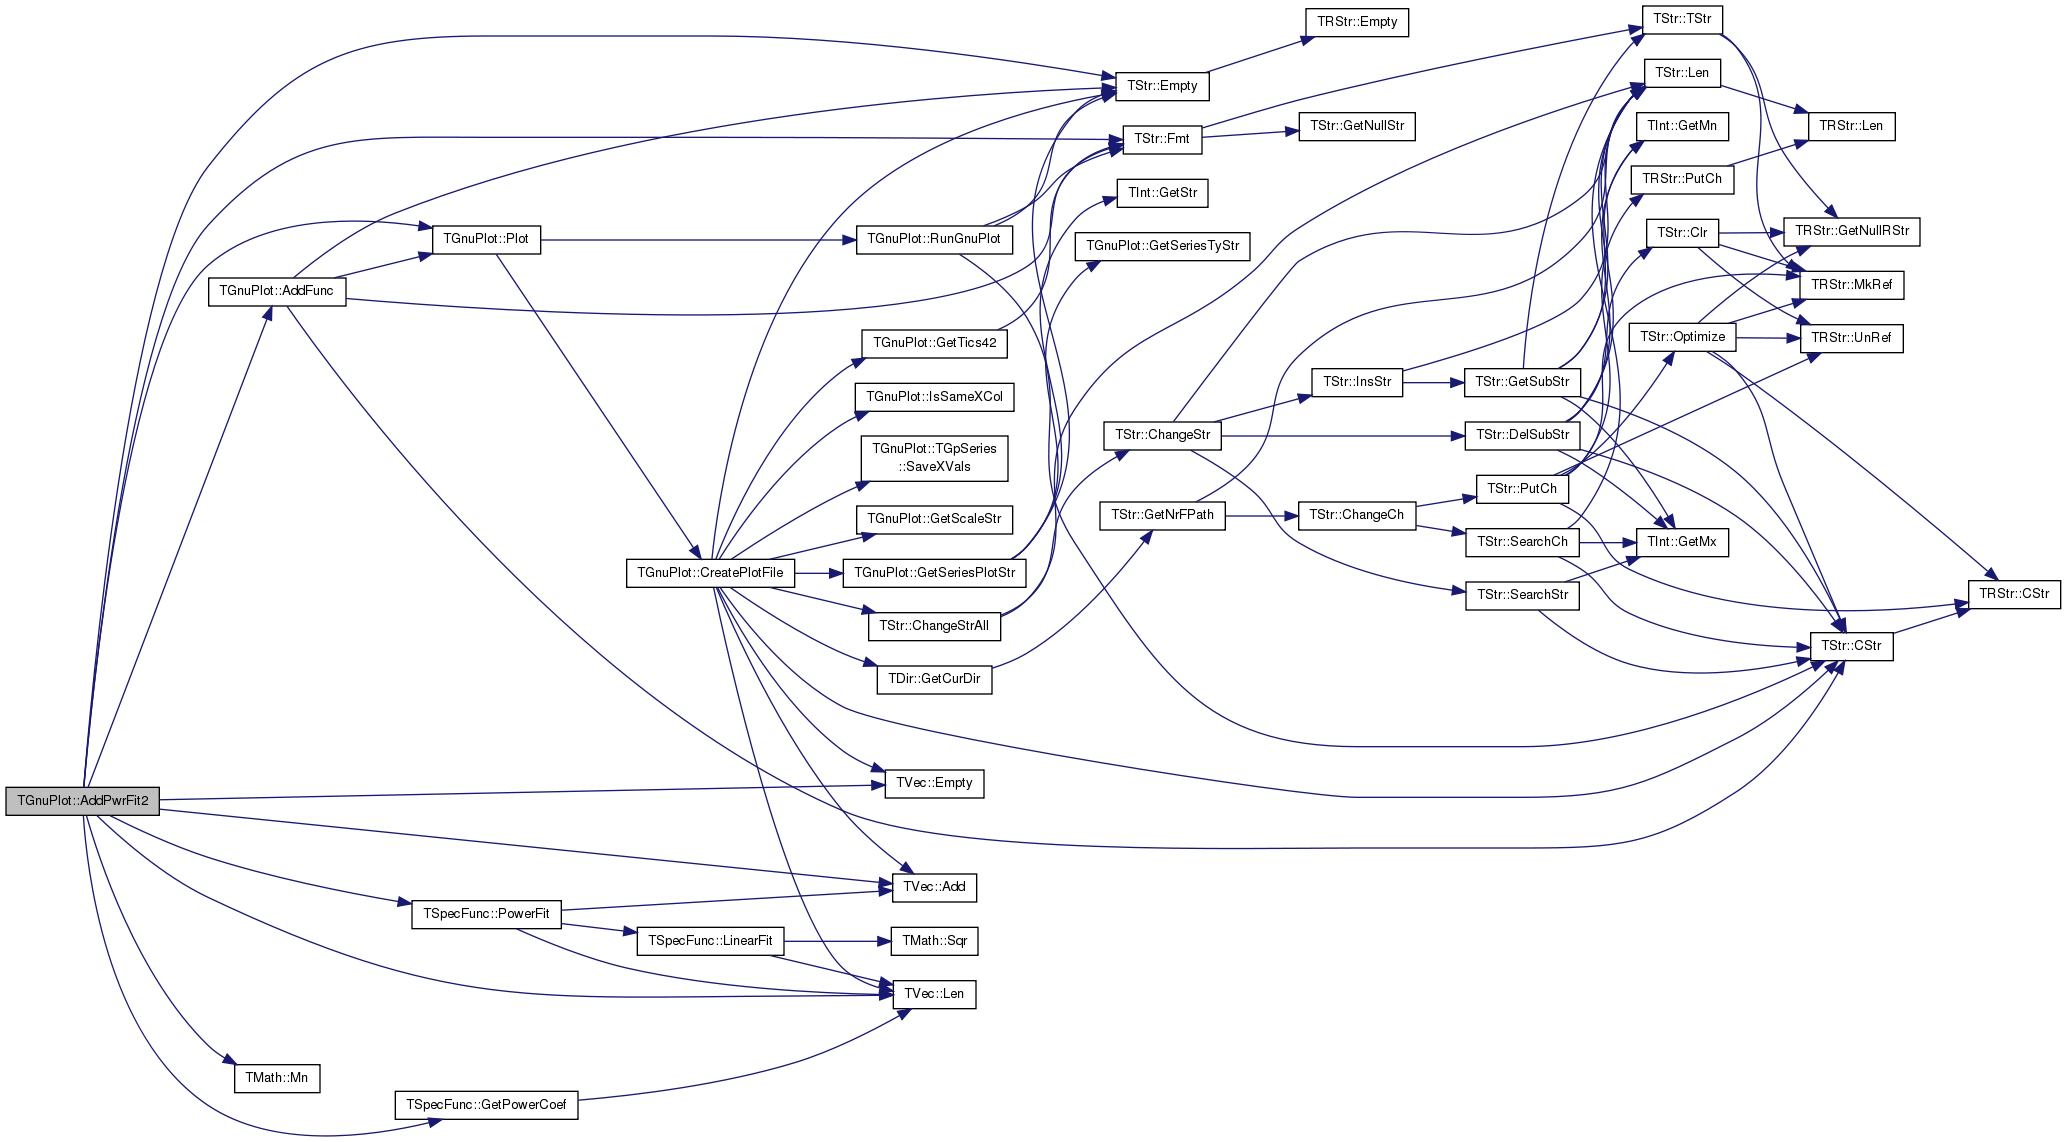
| int | AddPwrFit2 (const int &PlotId, const TGpSeriesTy &SeriesTy=gpwLines, const double &MinX=-1.0, const TStr &Style=TStr()) |
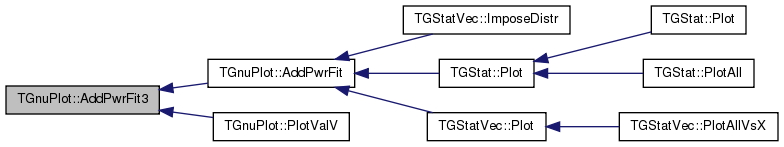
| int | AddPwrFit3 (const int &PlotId, const TGpSeriesTy &SeriesTy=gpwLines, const double &MinX=-1.0, const TStr &Style=TStr()) |
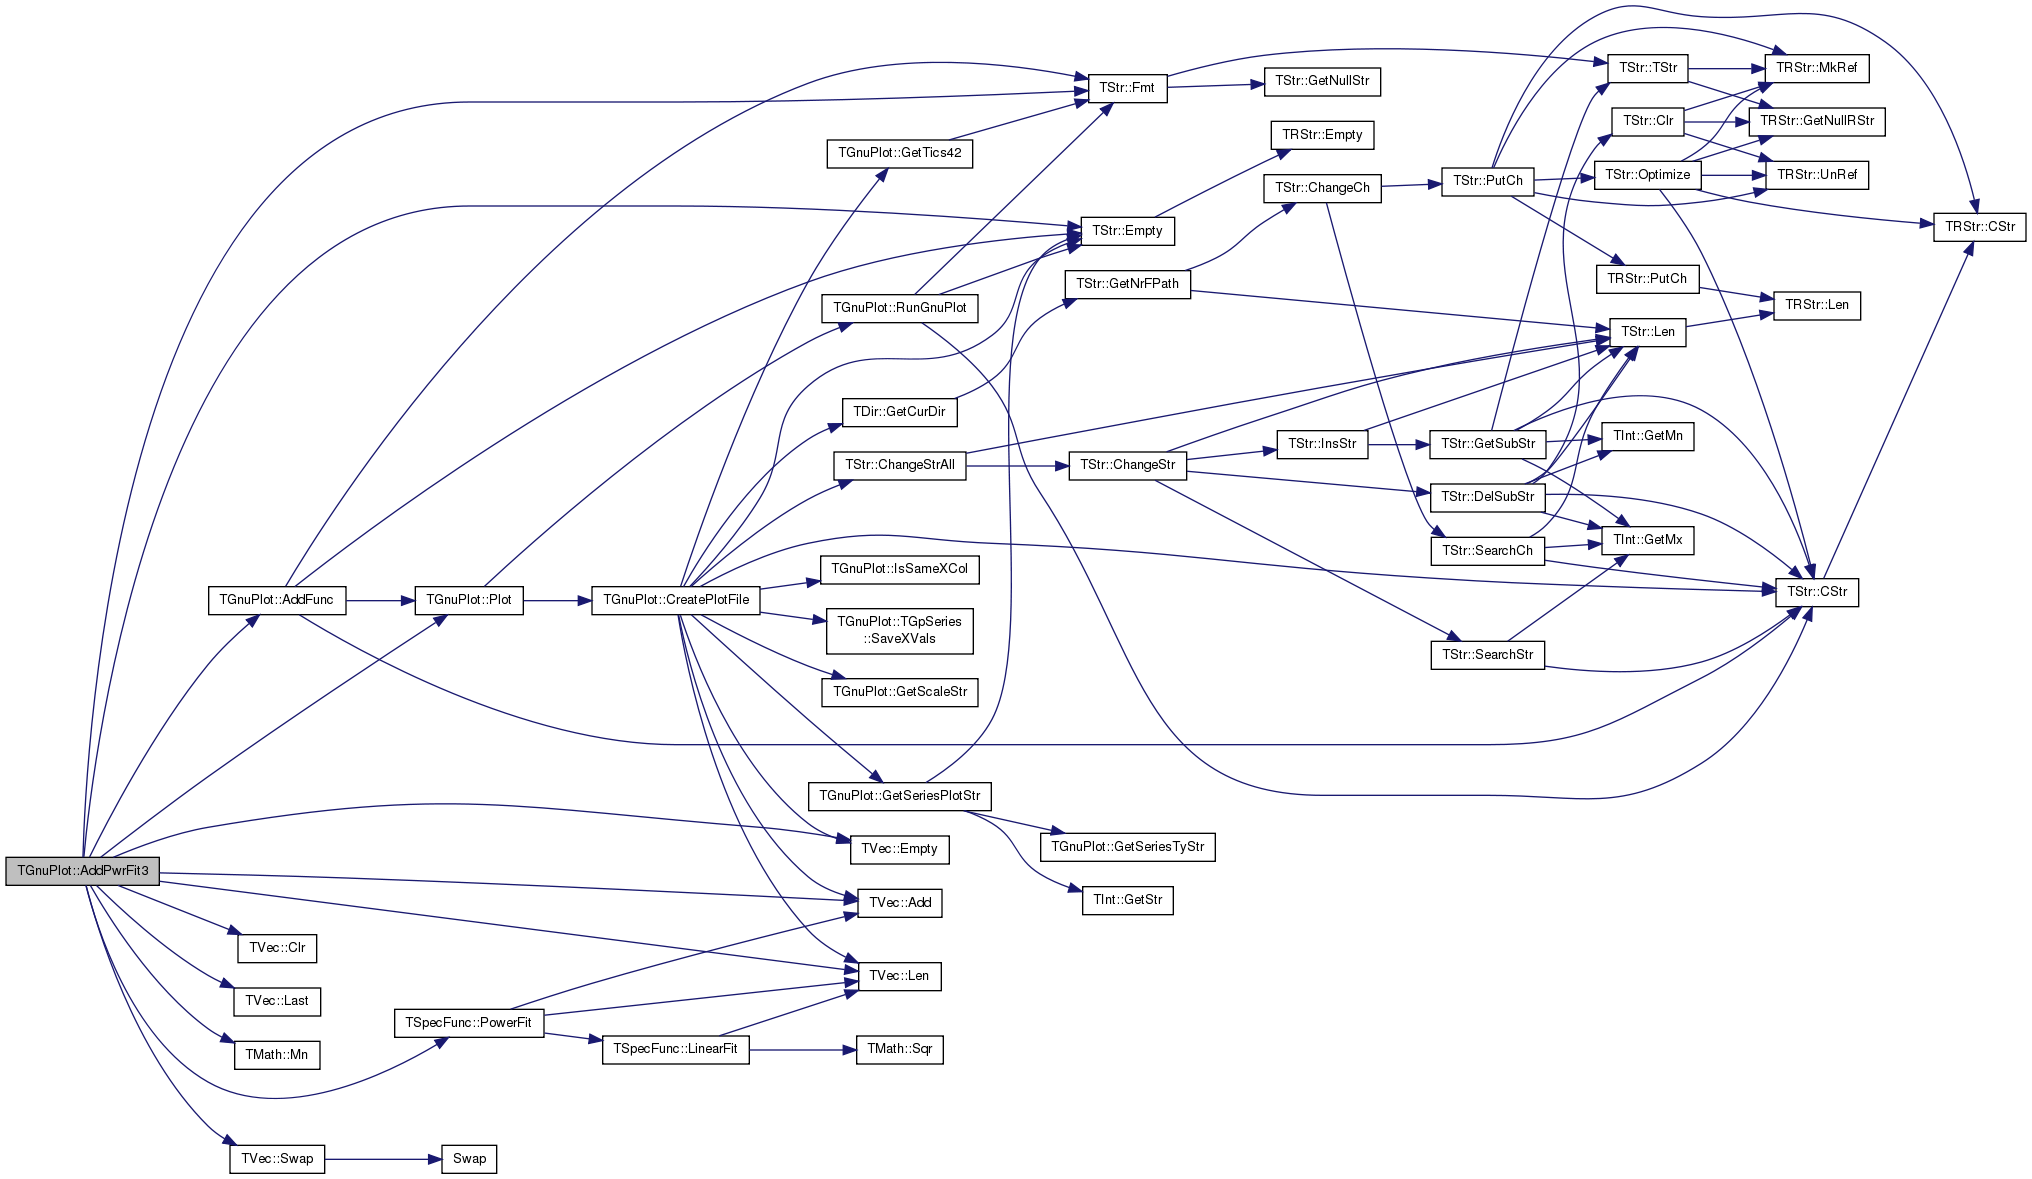
| int | AddPwrFit3 (const int &PlotId, const TGpSeriesTy &SeriesTy, const double &MinX, const TStr &Style, double &Intercept, double &Slope, double &R2) |
| int | AddLogFit (const int &PlotId, const TGpSeriesTy &SeriesTy=gpwLines, const TStr &Style=TStr()) |
| int | AddExpFit (const int &PlotId, const TGpSeriesTy &SeriesTy=gpwLines, const double &FitXOffset=0.0, const TStr &Style=TStr()) |
| void | SavePng (const int &SizeX=1000, const int &SizeY=800, const TStr &Comment=TStr()) |
| void | SavePng (const TStr &FNm, const int &SizeX=1000, const int &SizeY=800, const TStr &Comment=TStr(), const TStr &Terminal=TStr()) |
| void | SaveEps (const int &FontSz=30, const TStr &Comment=TStr()) |
| void | SaveEps (const TStr &FNm, const int &FontSz=30, const TStr &Comment=TStr()) |
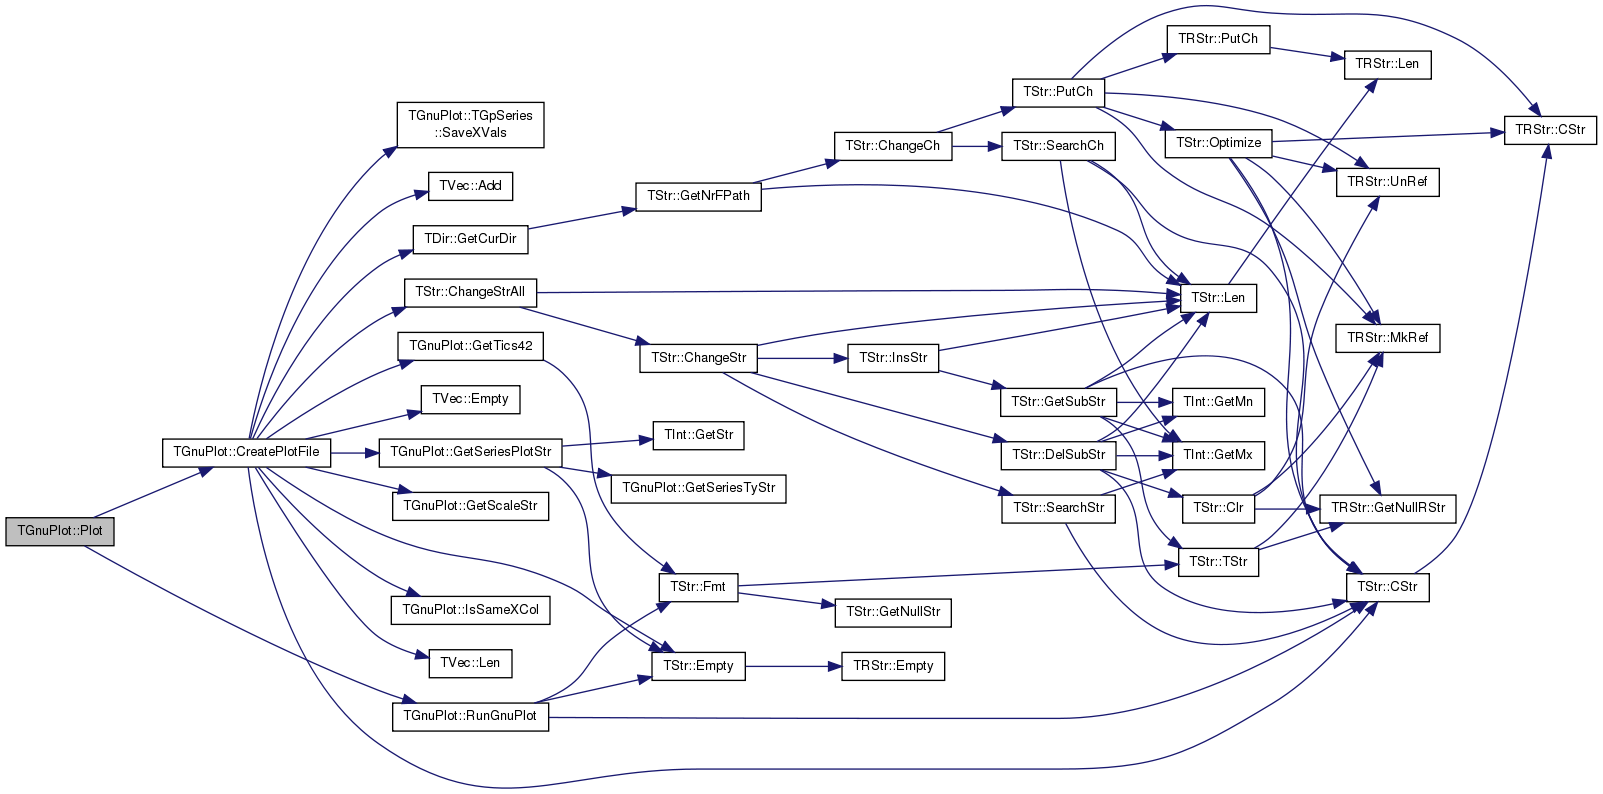
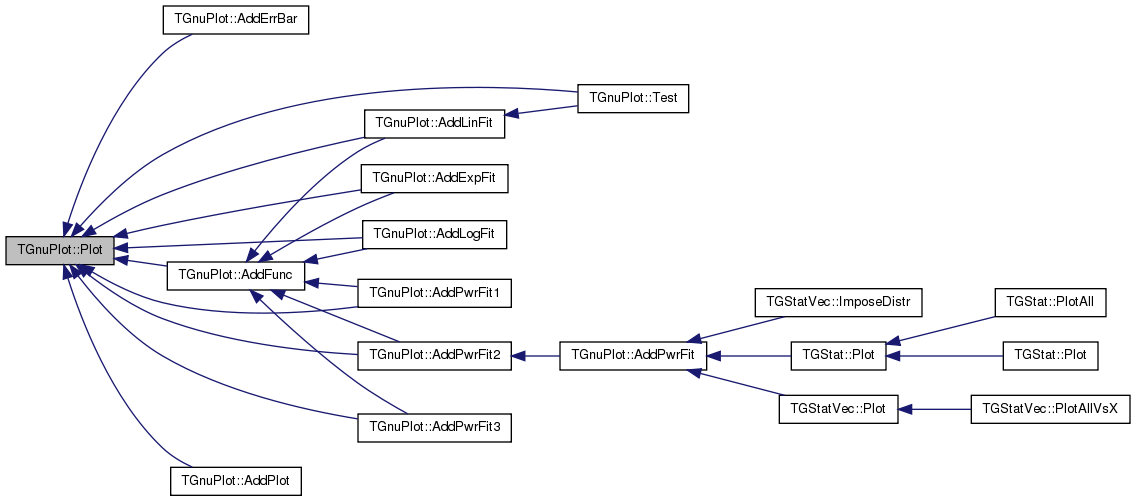
| void | Plot (const TStr &Comment=TStr()) |
Static Public Member Functions | |
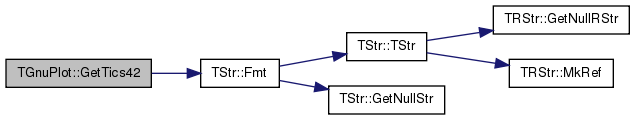
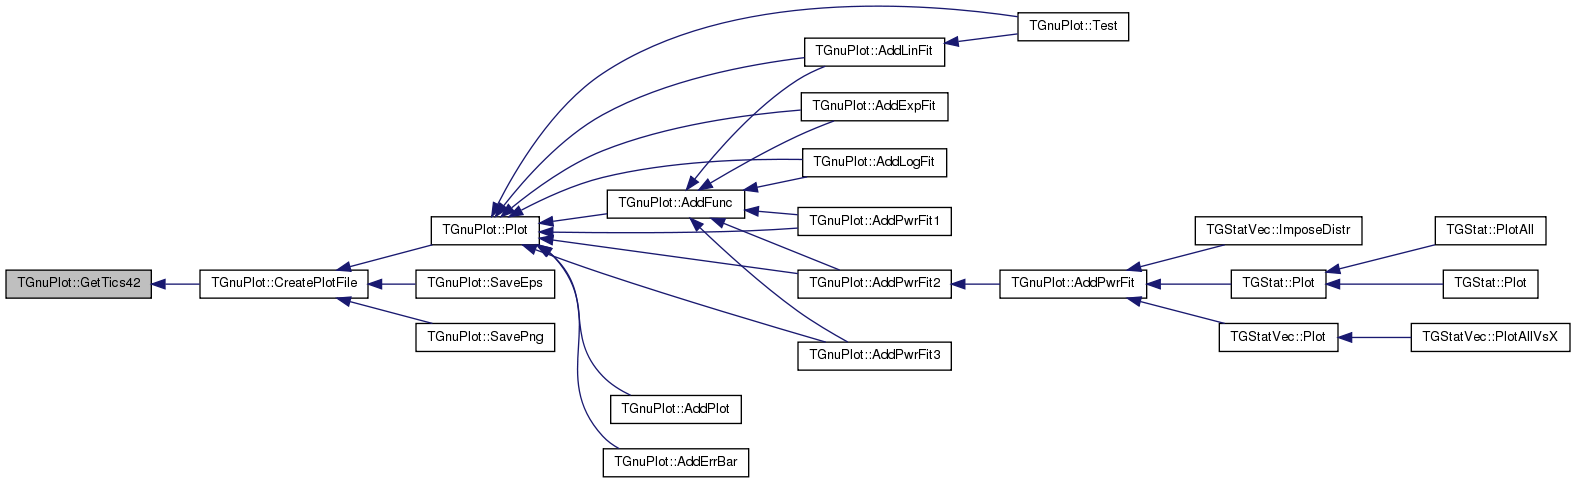
| static int | GetTics42 () |
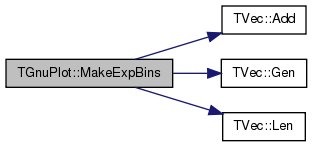
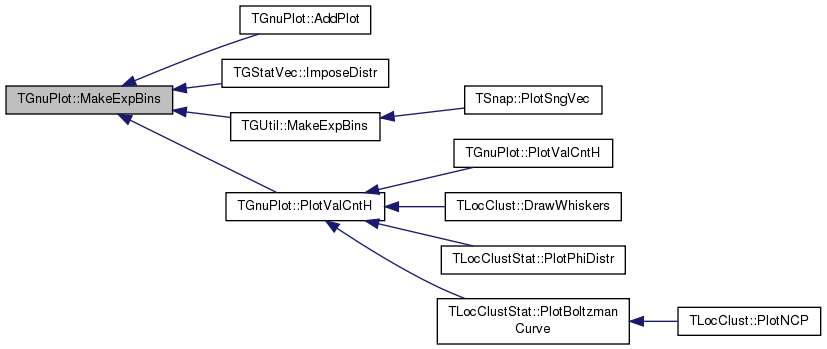
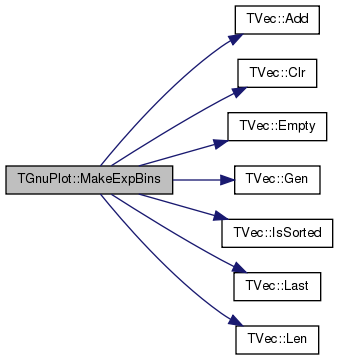
| static void | MakeExpBins (const TFltPrV &XYValV, TFltPrV &ExpXYValV, const double &BinFactor=2, const double &MinYVal=1) |
| static void | MakeExpBins (const TFltKdV &XYValV, TFltKdV &ExpXYValV, const double &BinFactor=2, const double &MinYVal=1) |
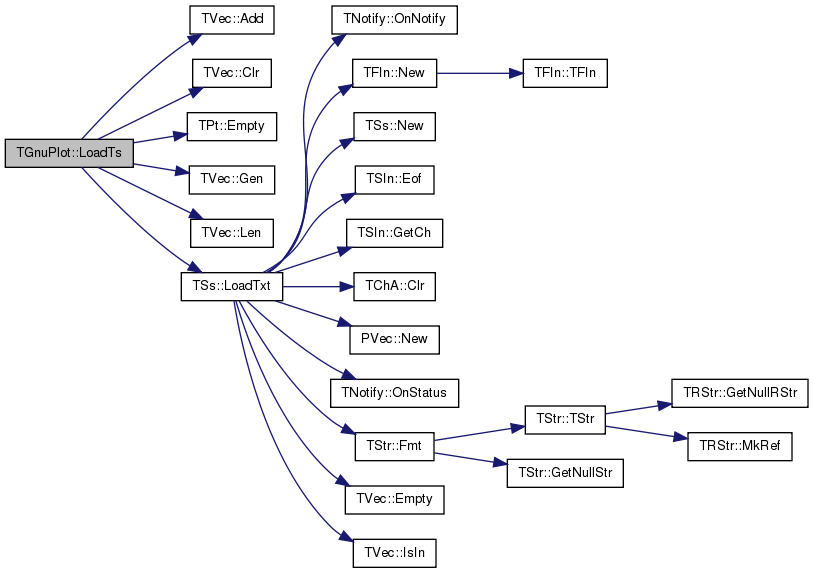
| static void | LoadTs (const TStr &FNm, TStrV &ColNmV, TVec< TFltKdV > &ColV) |
| static TStr | GetScaleStr (const TGpScaleTy &ScaleTy) |
| static TStr | GetSeriesTyStr (const TGpSeriesTy &SeriesTy) |
| static void | SaveTs (const TIntKdV &KdV, const TStr &FNm, const TStr &HeadLn=TStr()) |
| static void | SaveTs (const TIntFltKdV &KdV, const TStr &FNm, const TStr &HeadLn=TStr()) |
| template<class TVal1 , class TVal2 > | |
| static void | SaveTs (const TVec< TPair< TVal1, TVal2 > > &ValV, const TStr &FNm, const TStr &HeadLn=TStr()) |
| template<class TVal1 , class TVal2 , class TVal3 > | |
| static void | SaveTs (const TVec< TTriple< TVal1, TVal2, TVal3 > > &ValV, const TStr &FNm, const TStr &HeadLn=TStr()) |
| template<class TVal , int Vals> | |
| static void | SaveTs (const TVec< TTuple< TVal, Vals > > &ValV, const TStr &FNm, const TStr &HeadLn=TStr()) |
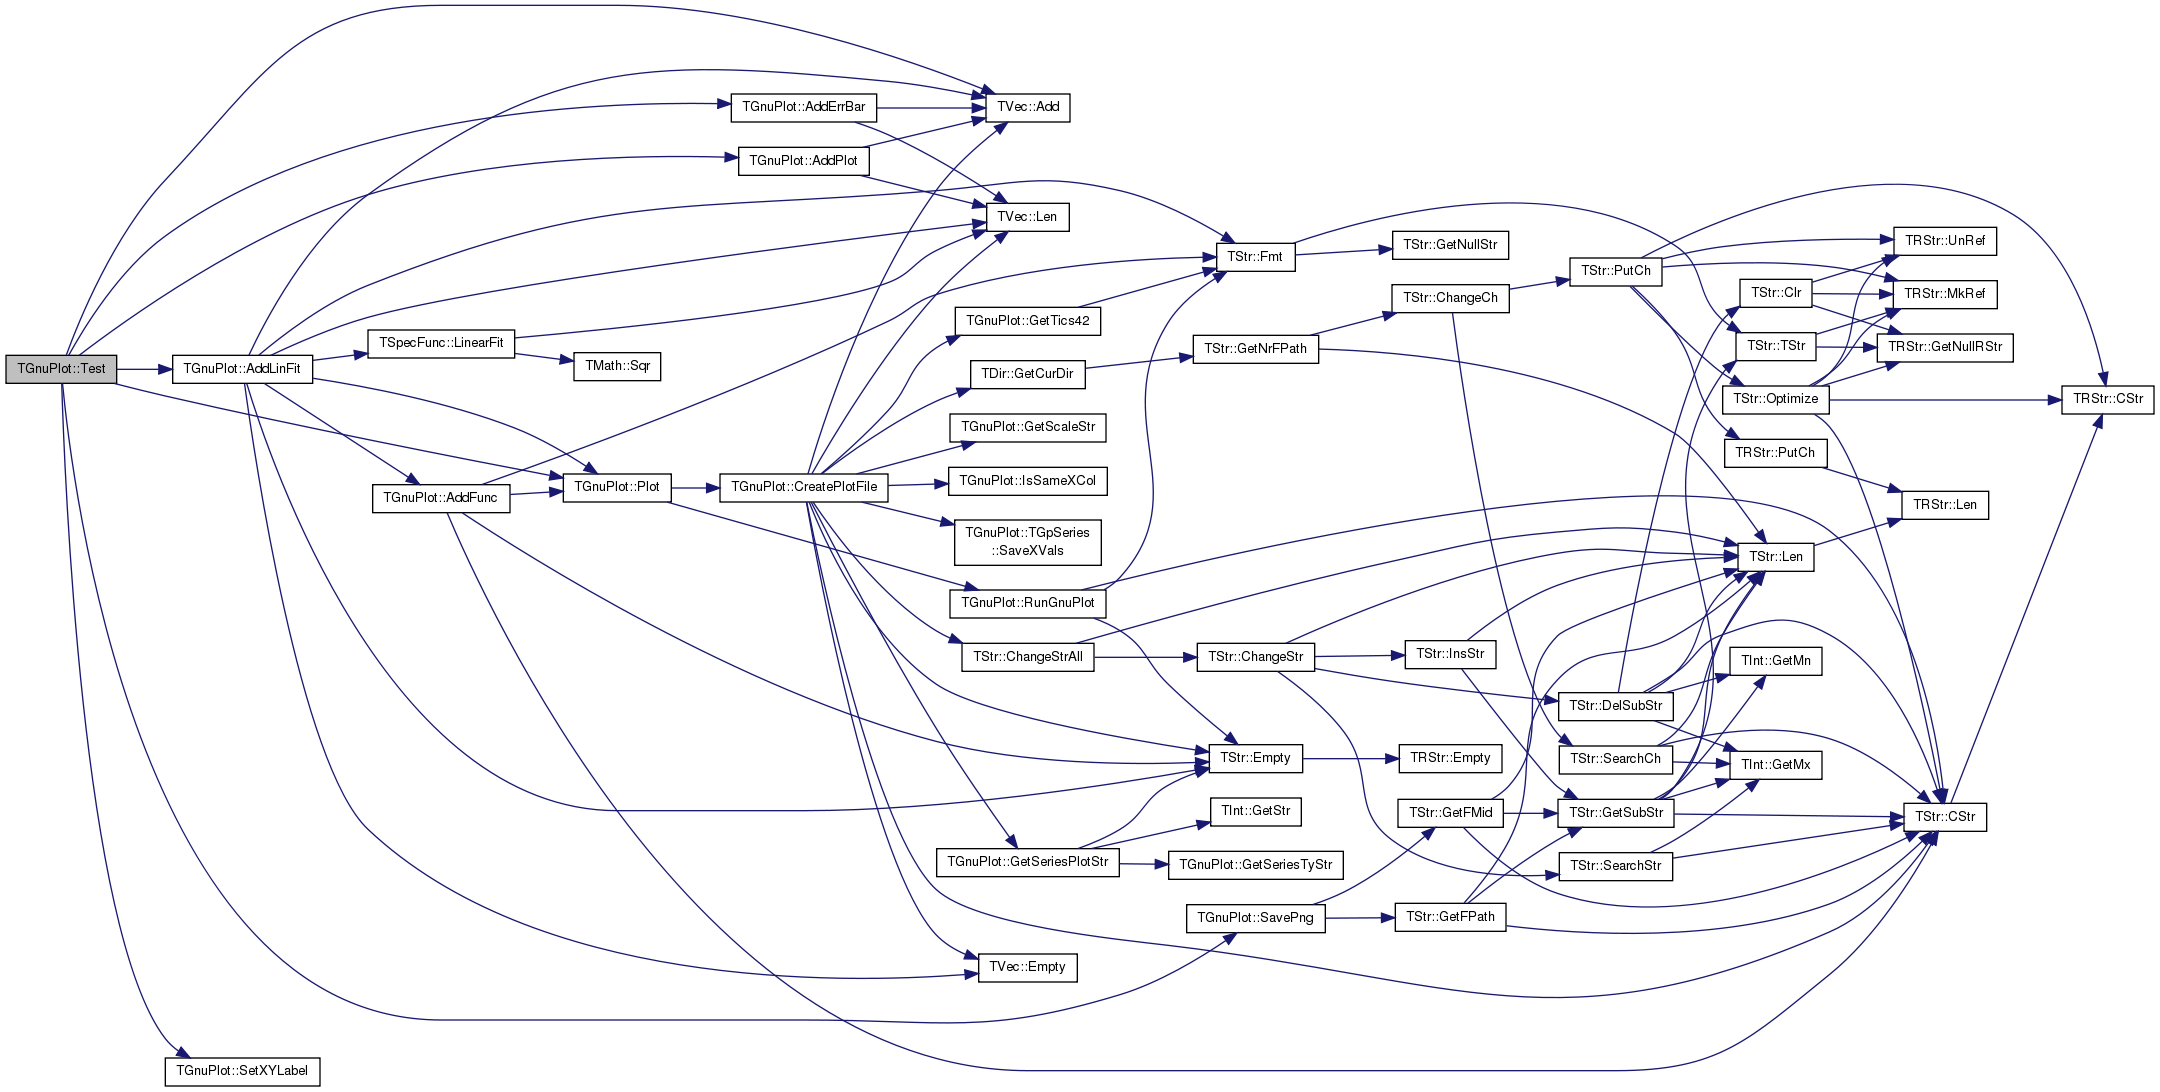
| static void | Test () |
| template<class TVal1 > | |
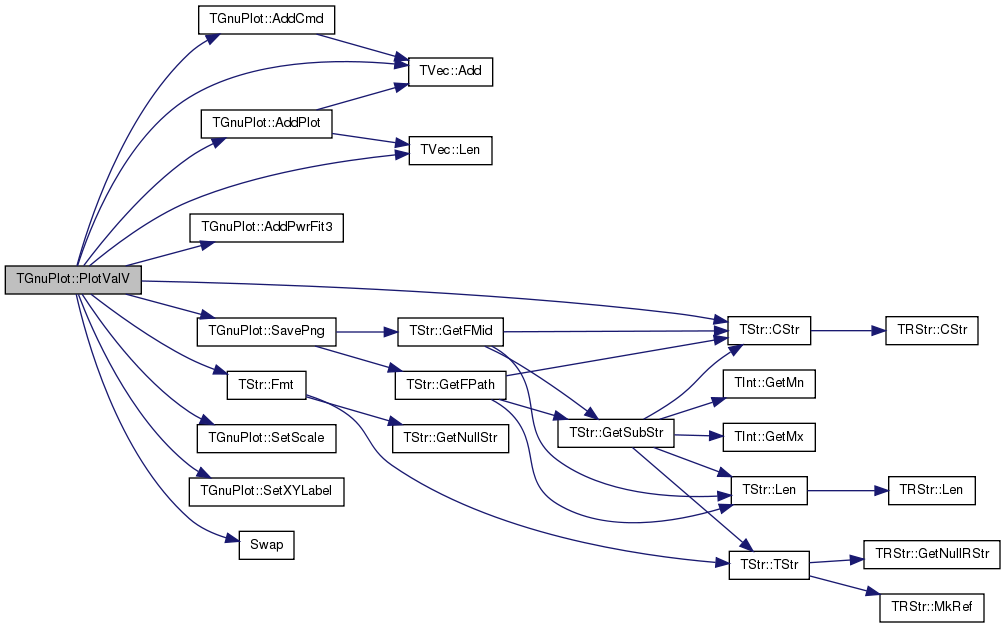
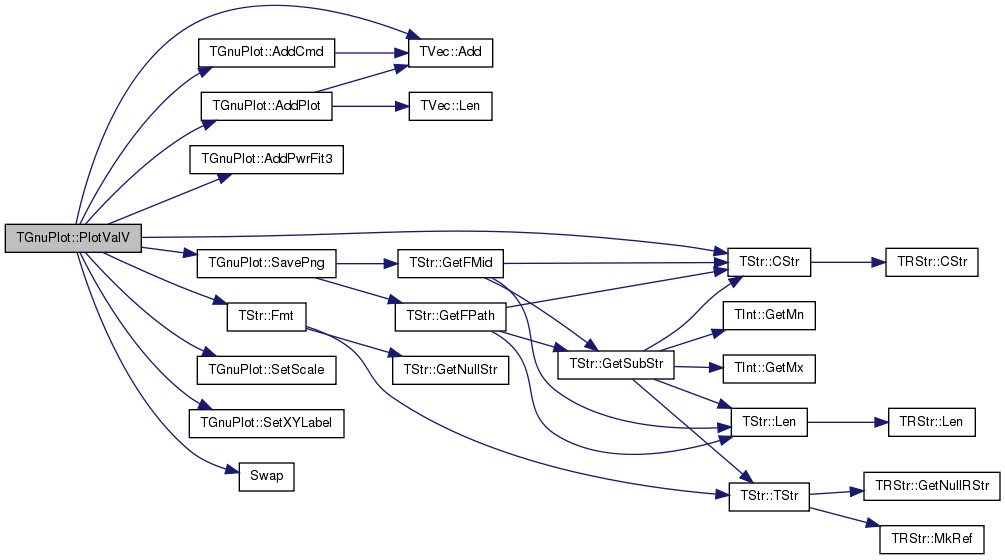
| static void | PlotValV (const TVec< TVal1 > &ValV, const TStr &OutFNmPref, const TStr &Desc="", const TStr &XLabel="", const TStr &YLabel="", const TGpScaleTy &ScaleTy=gpsAuto, const bool &PowerFit=false, const TGpSeriesTy &SeriesTy=gpwLinesPoints) |
| template<class TVal1 , class TVal2 > | |
| static void | PlotValV (const TVec< TPair< TVal1, TVal2 > > &ValV, const TStr &OutFNmPref, const TStr &Desc="", const TStr &XLabel="", const TStr &YLabel="", const TGpScaleTy &ScaleTy=gpsAuto, const bool &PowerFit=false, const TGpSeriesTy &SeriesTy=gpwLinesPoints) |
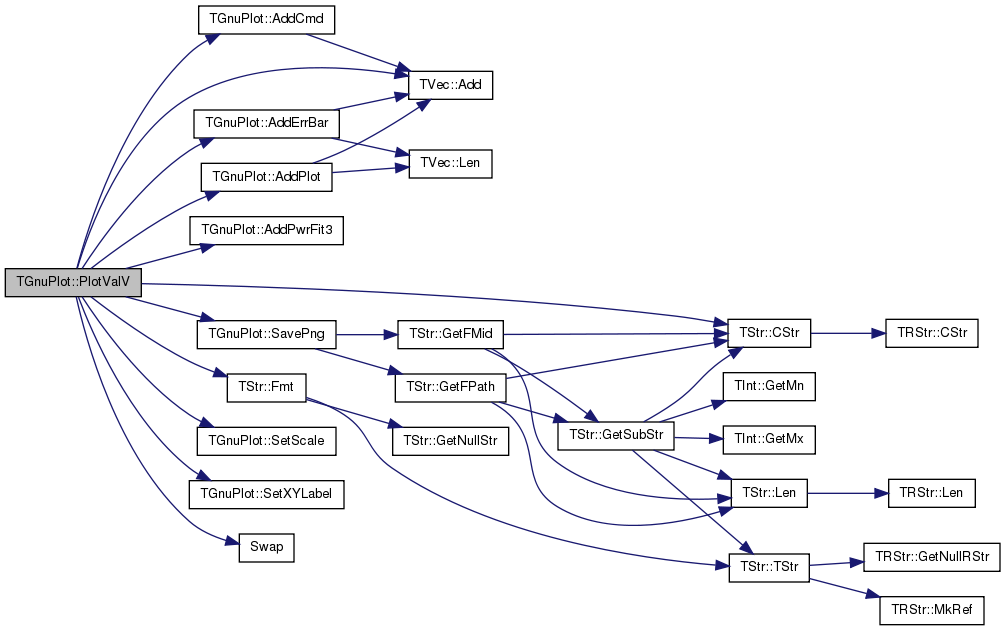
| template<class TVal1 , class TVal2 , class TVal3 > | |
| static void | PlotValV (const TVec< TTriple< TVal1, TVal2, TVal3 > > &ValV, const TStr &OutFNmPref, const TStr &Desc="", const TStr &XLabel="", const TStr &YLabel="", const TGpScaleTy &ScaleTy=gpsAuto, const bool &PowerFit=false, const TGpSeriesTy &SeriesTy=gpwLinesPoints, const TStr &ErrBarStr="") |
| template<class TVal1 , class TVal2 > | |
| static void | PlotValV (const TVec< TPair< TVal1, TVal2 > > &ValV1, const TStr &Name1, const TVec< TPair< TVal1, TVal2 > > &ValV2, const TStr &Name2, const TStr &OutFNmPref, const TStr &Desc="", const TStr &XLabel="", const TStr &YLabel="", const TGpScaleTy &ScaleTy=gpsAuto, const bool &PowerFit=false, const TGpSeriesTy &SeriesTy=gpwLinesPoints) |
| template<class TKey , class TVal , class THashFunc > | |
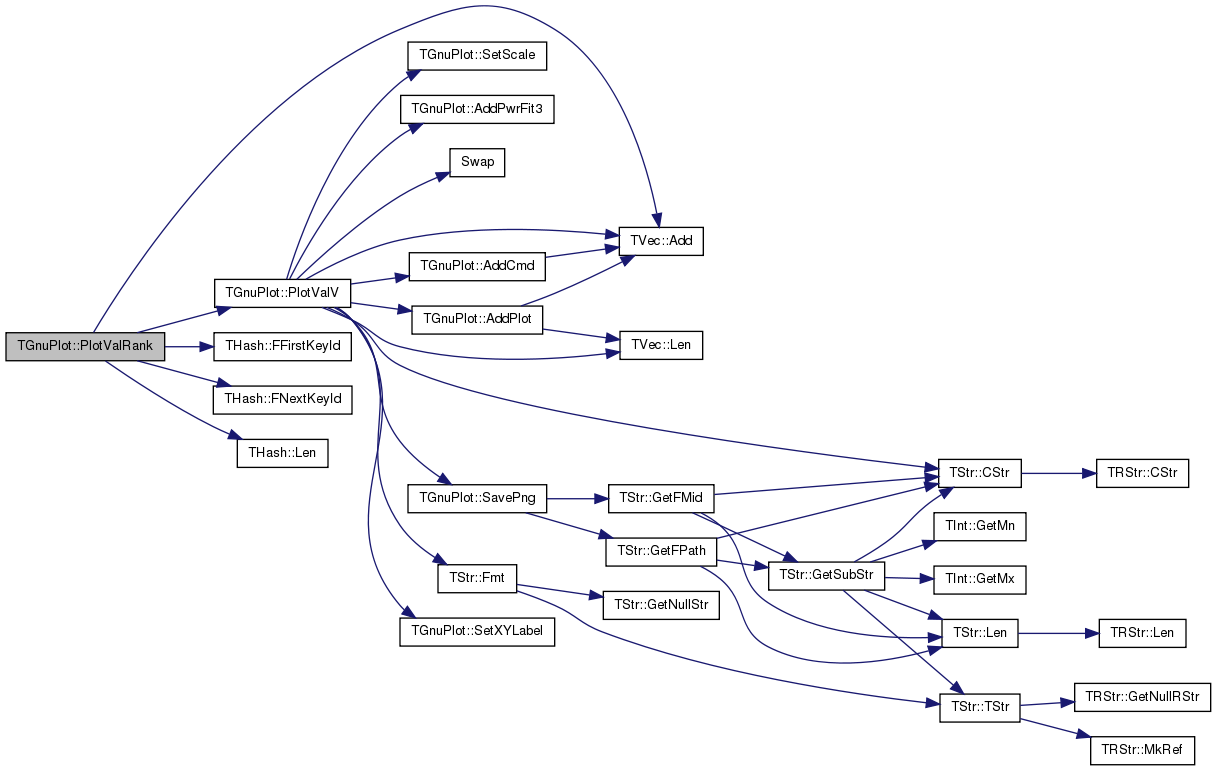
| static void | PlotValRank (const THash< TKey, TVal, THashFunc > &ValCntH, const TStr &OutFNmPref, const TStr &Desc="", const TStr &XLabel="", const TStr &YLabel="", const TGpScaleTy &ScaleTy=gpsAuto, const bool &PowerFit=false, const TGpSeriesTy &SeriesTy=gpwLinesPoints) |
| template<class TKey , class TVal , class THashFunc > | |
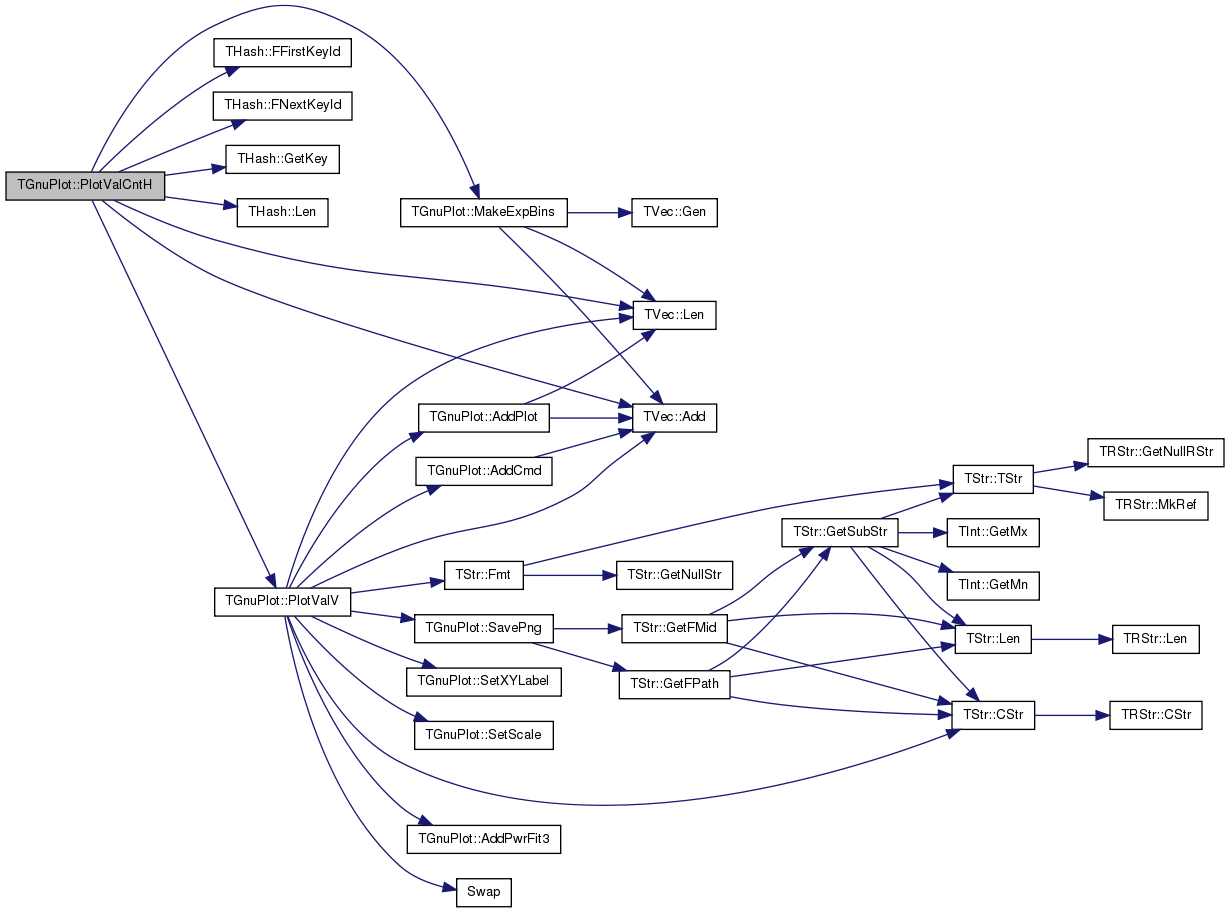
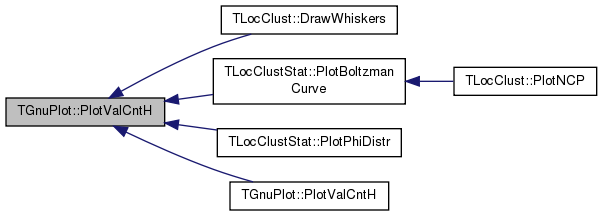
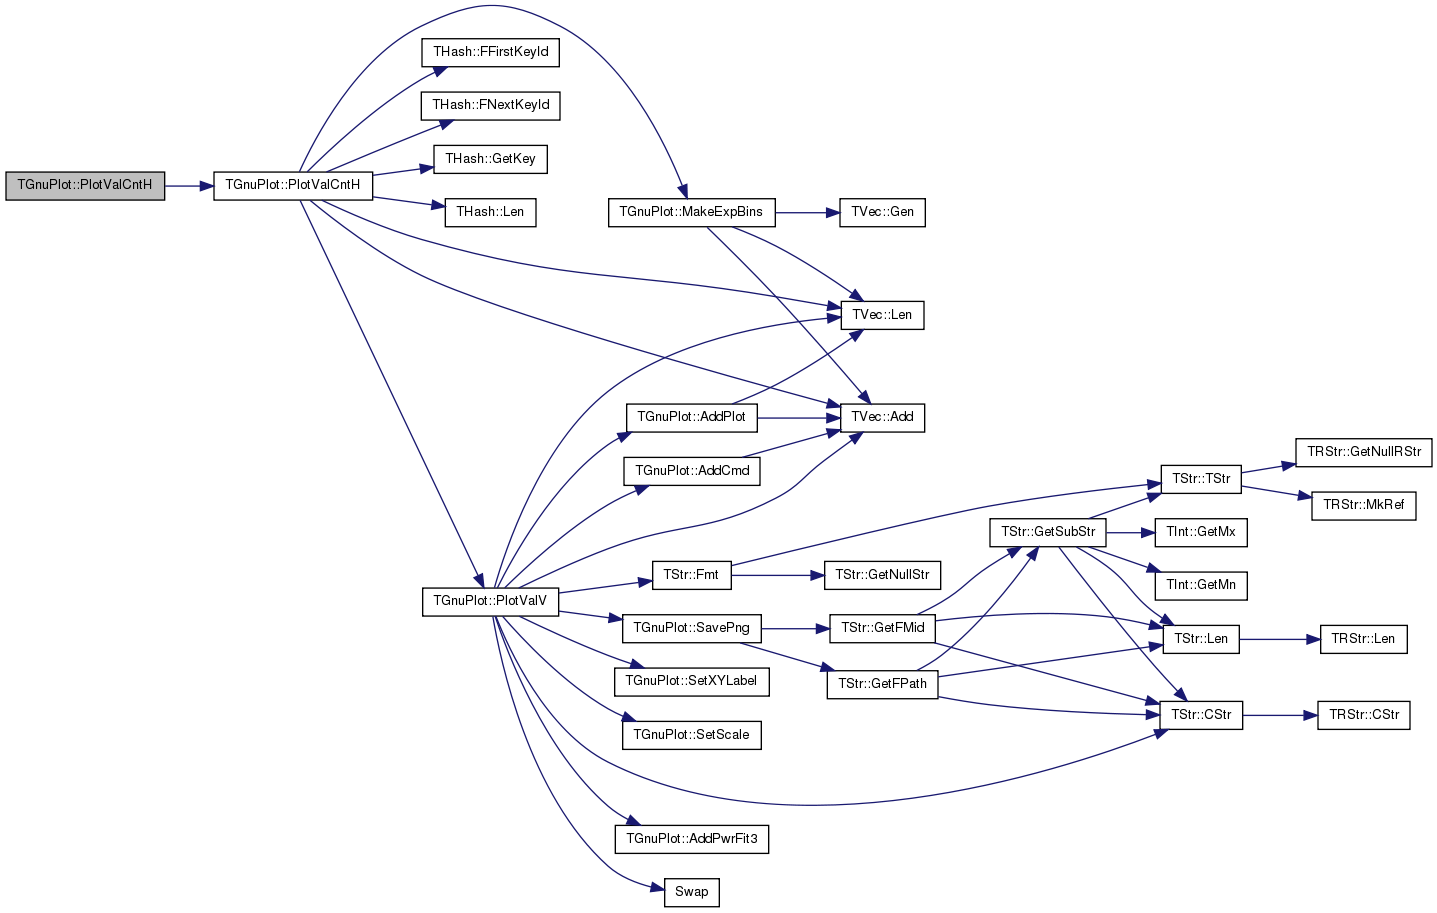
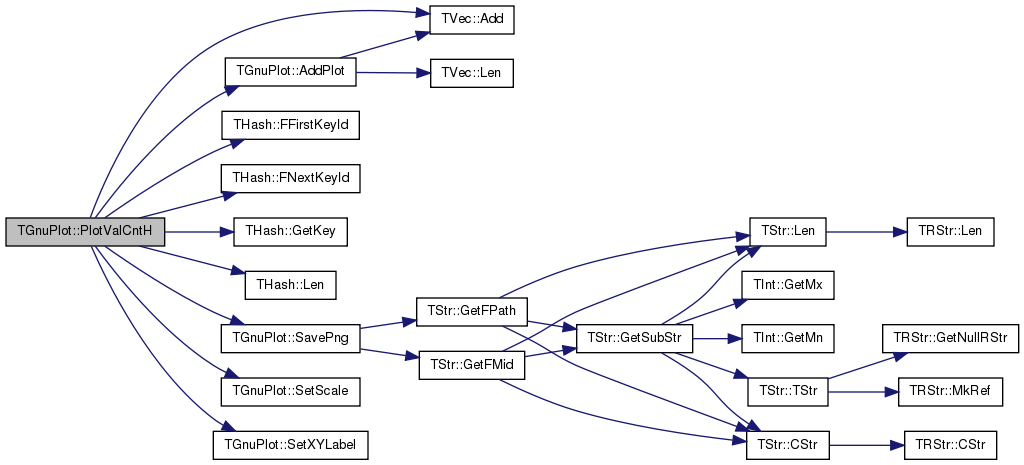
| static void | PlotValCntH (const THash< TKey, TVal, THashFunc > &ValCntH, const TStr &OutFNmPref, const TStr &Desc="", const TStr &XLabel="", const TStr &YLabel="", const TGpScaleTy &ScaleTy=gpsAuto, const bool &PowerFit=false, const TGpSeriesTy &SeriesTy=gpwLinesPoints, const bool &PlotCCDF=false, const bool &ExpBucket=false) |
| template<class TKey , class TVal , class THashFunc > | |
| static void | PlotValCntH (const THash< TKey, TVal, THashFunc > &ValCntH1, const TStr &Label1, const THash< TKey, TVal, THashFunc > &ValCntH2, const TStr &Label2, const TStr &OutFNmPref, const TStr &Desc, const TStr &XLabel, const TStr &YLabel, const TGpScaleTy &ScaleTy=gpsAuto, const TGpSeriesTy &SeriesTy=gpwLinesPoints) |
| template<class TKey , class TVal , class THashFunc > | |
| static void | PlotValCntH (const THash< TKey, TVal, THashFunc > &ValCntH1, const TStr &Label1, const THash< TKey, TVal, THashFunc > &ValCntH2, const TStr &Label2, const THash< TKey, TVal, THashFunc > &ValCntH3, const TStr &Label3, const TStr &OutFNmPref, const TStr &Desc, const TStr &XLabel, const TStr &YLabel, const TGpScaleTy &ScaleTy=gpsAuto, const TGpSeriesTy &SeriesTy=gpwLinesPoints) |
| template<class TVal1 > | |
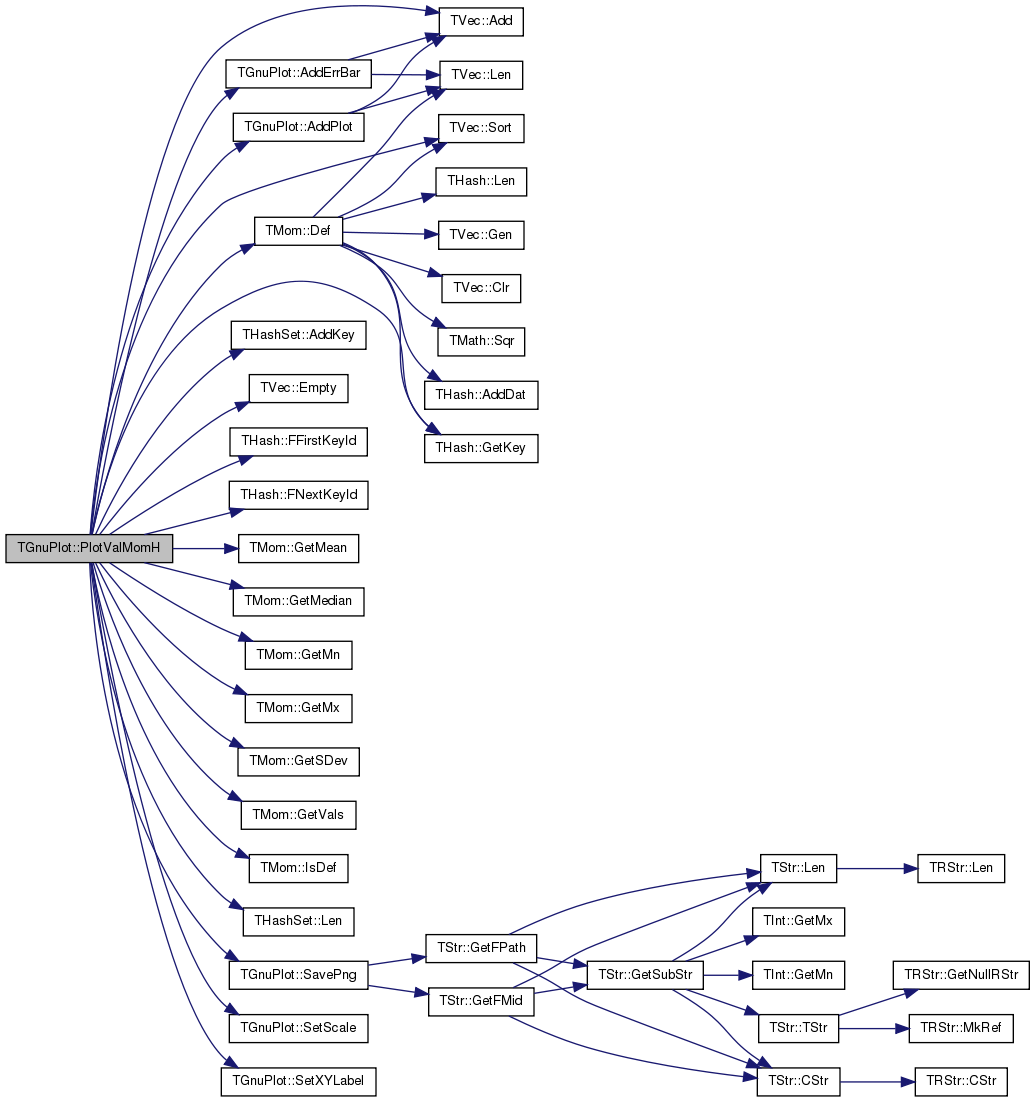
| static void | PlotValMomH (const THash< TVal1, TMom > &ValMomH, const TStr &OutFNmPref, const TStr &Desc="", const TStr &XLabel="", const TStr &YLabel="", const TGpScaleTy &ScaleTy=gpsAuto, const TGpSeriesTy &SeriesTy=gpwLinesPoints, bool PlotAvg=true, bool PlotMed=true, bool PlotMin=false, bool PlotMax=false, bool PlotSDev=false, bool PlotStdErr=true, bool PlotScatter=false) |
| template<class TVal1 > | |
| static void | PlotValMomH (const THash< TVal1, TMom > &ValMomH1, const TStr &Label1, const THash< TVal1, TMom > &ValMomH2, const TStr &Label2, const TStr &OutFNmPref, const TStr &Desc="", const TStr &XLabel="", const TStr &YLabel="", const TGpScaleTy &ScaleTy=gpsAuto, const TGpSeriesTy &SeriesTy=gpwLinesPoints, bool PlotAvg=true, bool PlotMed=true, bool PlotMin=false, bool PlotMax=false, bool PlotSDev=false, bool PlotStdErr=true, bool PlotScatter=false) |
| template<class TVal2 > | |
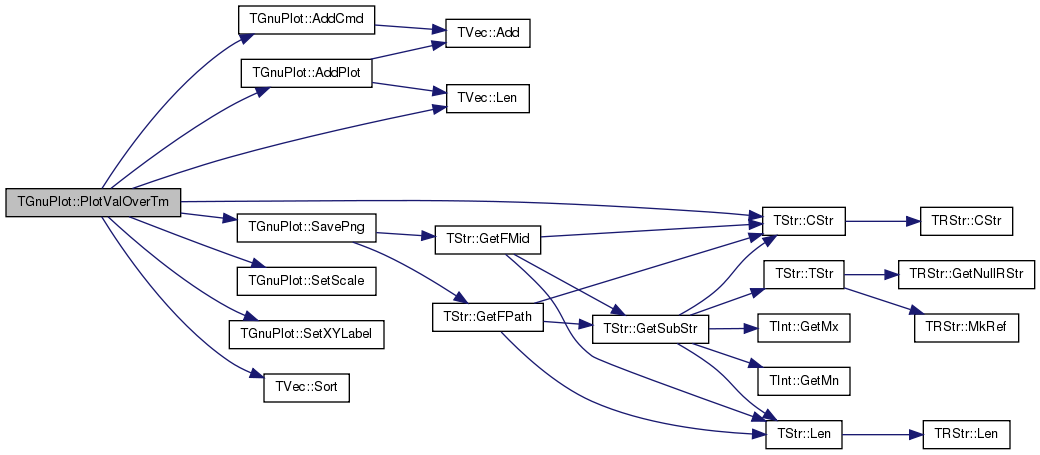
| static void | PlotValOverTm (const TVec< TPair< TSecTm, TVal2 > > &ValV, const TStr &OutFNmPref, const TStr &Desc="", const TStr &XLabel="", const TStr &YLabel="", const TGpScaleTy &ScaleTy=gpsAuto, const TGpSeriesTy &SeriesTy=gpwLinesPoints) |
| template<class TVal2 > | |
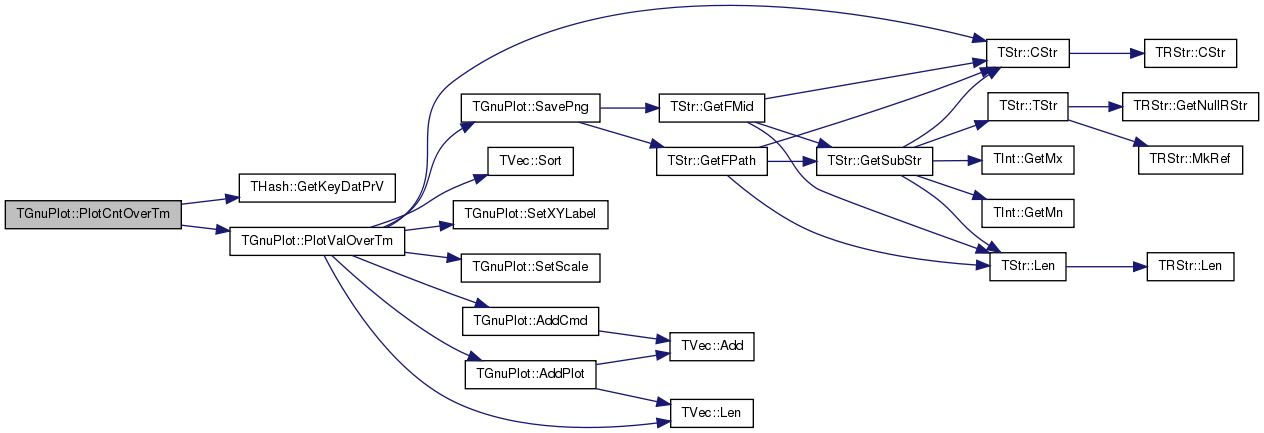
| static void | PlotCntOverTm (const THash< TSecTm, TVal2 > &CntH, const TStr &OutFNmPref, const TStr &Desc="", const TStr &XLabel="", const TStr &YLabel="", const TGpScaleTy &ScaleTy=gpsAuto, const TGpSeriesTy &SeriesTy=gpwLinesPoints) |
Static Public Attributes | |
| static TStr | GnuPlotPath = "/usr/bin" |
| Path to GnuPlot executable. Set if gnuplot is not found in the PATH. More... | |
| static TStr | GnuPlotFNm = "gnuplot" |
| GnuPlot executable file name. Set if different than the standard wgnuplot/gnuplot. More... | |
| static TStr | DefPlotFNm = "GnuPlot.plt" |
| static TStr | DefDataFNm = "GnuPlot.tab" |
Private Attributes | |
| TStr | DataFNm |
| TStr | PlotFNm |
| TStr | Title |
| TStr | LblX |
| TStr | LblY |
| TGpScaleTy | ScaleTy |
| TFltPr | YRange |
| TFltPr | XRange |
| bool | SetGrid |
| bool | SetPause |
| TVec< TGpSeries > | SeriesV |
| TStrV | MoreCmds |
Static Private Attributes | |
| static int | Tics42 = -2 |
| TGnuPlot::TGnuPlot | ( | const TStr & | FileNm = "gplot", |
| const TStr & | PlotTitle = TStr(), |
||
| const bool & | Grid = true |
||
| ) |
Definition at line 86 of file gnuplot.cpp.
References TStr::Empty(), and IAssert.

| TGnuPlot::TGnuPlot | ( | const TStr & | DataFileNm, |
| const TStr & | PlotFileNm, | ||
| const TStr & | PlotTitle, | ||
| const bool & | Grid | ||
| ) |
Definition at line 93 of file gnuplot.cpp.
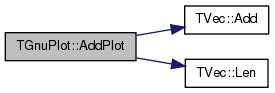
| TGnuPlot::TGnuPlot | ( | const TGnuPlot & | GnuPlot | ) |
|
inline |
Definition at line 81 of file gnuplot.h.
References TVec< TVal, TSizeTy >::Add().
Referenced by TLocClustStat::PlotBestClustDens(), TMAGFitBern::PlotProperties(), PlotValOverTm(), PlotValV(), SaveEps(), and SavePng().
Definition at line 265 of file gnuplot.cpp.
References TVec< TVal, TSizeTy >::Add(), and TVec< TVal, TSizeTy >::Len().
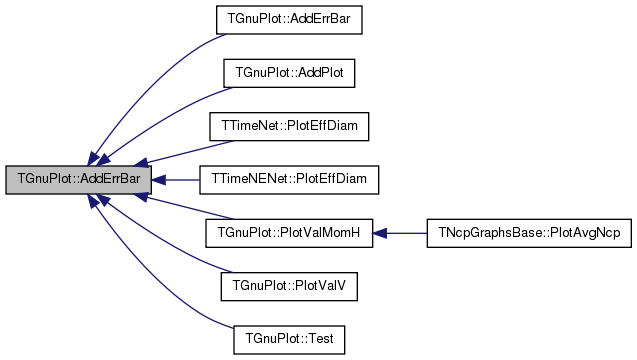
Referenced by AddErrBar(), AddPlot(), TTimeNet::PlotEffDiam(), TTimeNENet::PlotEffDiam(), PlotValMomH(), PlotValV(), and Test().
Definition at line 275 of file gnuplot.cpp.
References TVec< TVal, TSizeTy >::Add(), AddErrBar(), AddPlot(), gpwLinesPoints, and TVec< TVal, TSizeTy >::Len().

Definition at line 287 of file gnuplot.cpp.
References TVec< TVal, TSizeTy >::Add(), AddErrBar(), IAssert, and TVec< TVal, TSizeTy >::Len().

| int TGnuPlot::AddErrBar | ( | const TFltV & | XValV, |
| const TFltV & | YValV, | ||
| const TFltV & | DeltaYV, | ||
| const TStr & | Label = TStr() |
||
| ) |
Definition at line 296 of file gnuplot.cpp.
References TVec< TVal, TSizeTy >::Add(), AddErrBar(), IAssert, and TVec< TVal, TSizeTy >::Len().

| int TGnuPlot::AddErrBar | ( | const TFltPrV & | XYValV, |
| const TFltV & | DeltaYV, | ||
| const TStr & | Label = TStr() |
||
| ) |
Definition at line 306 of file gnuplot.cpp.
References TVec< TVal, TSizeTy >::Add(), AddErrBar(), and TVec< TVal, TSizeTy >::Len().

| int TGnuPlot::AddErrBar | ( | const TFltKdV & | XYValV, |
| const TFltV & | DeltaYV, | ||
| const TStr & | Label = TStr() |
||
| ) |
Definition at line 324 of file gnuplot.cpp.
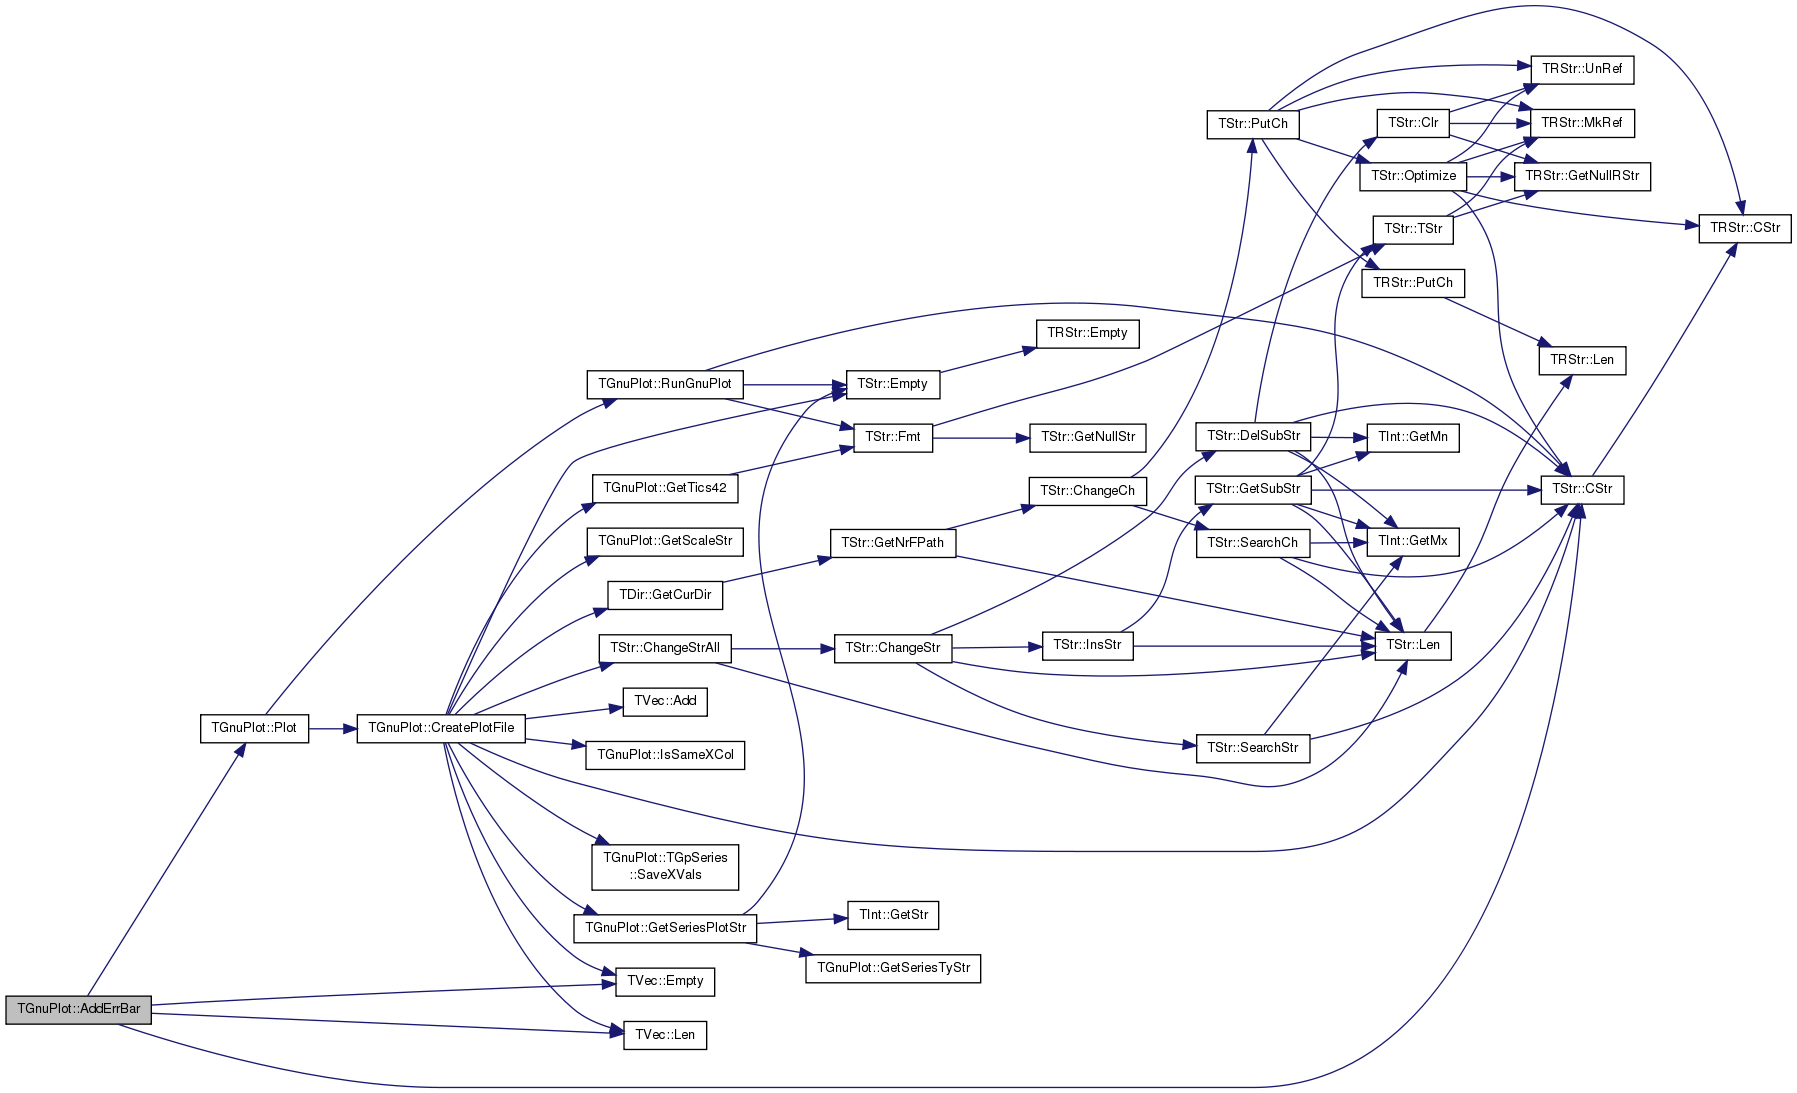
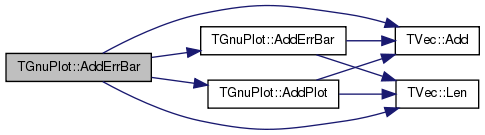
References TStr::CStr(), DataFNm, TVec< TVal, TSizeTy >::Empty(), gpwErrBars, IAssert, TVec< TVal, TSizeTy >::Len(), Plot(), SeriesV, and Title.
| int TGnuPlot::AddErrBar | ( | const TFltPrV & | XYValV, |
| const TFltV & | DeltaYV, | ||
| const TStr & | DatLabel, | ||
| const TStr & | ErrLabel | ||
| ) |
Definition at line 314 of file gnuplot.cpp.
References TVec< TVal, TSizeTy >::Add(), AddErrBar(), AddPlot(), gpwLinesPoints, and TVec< TVal, TSizeTy >::Len().
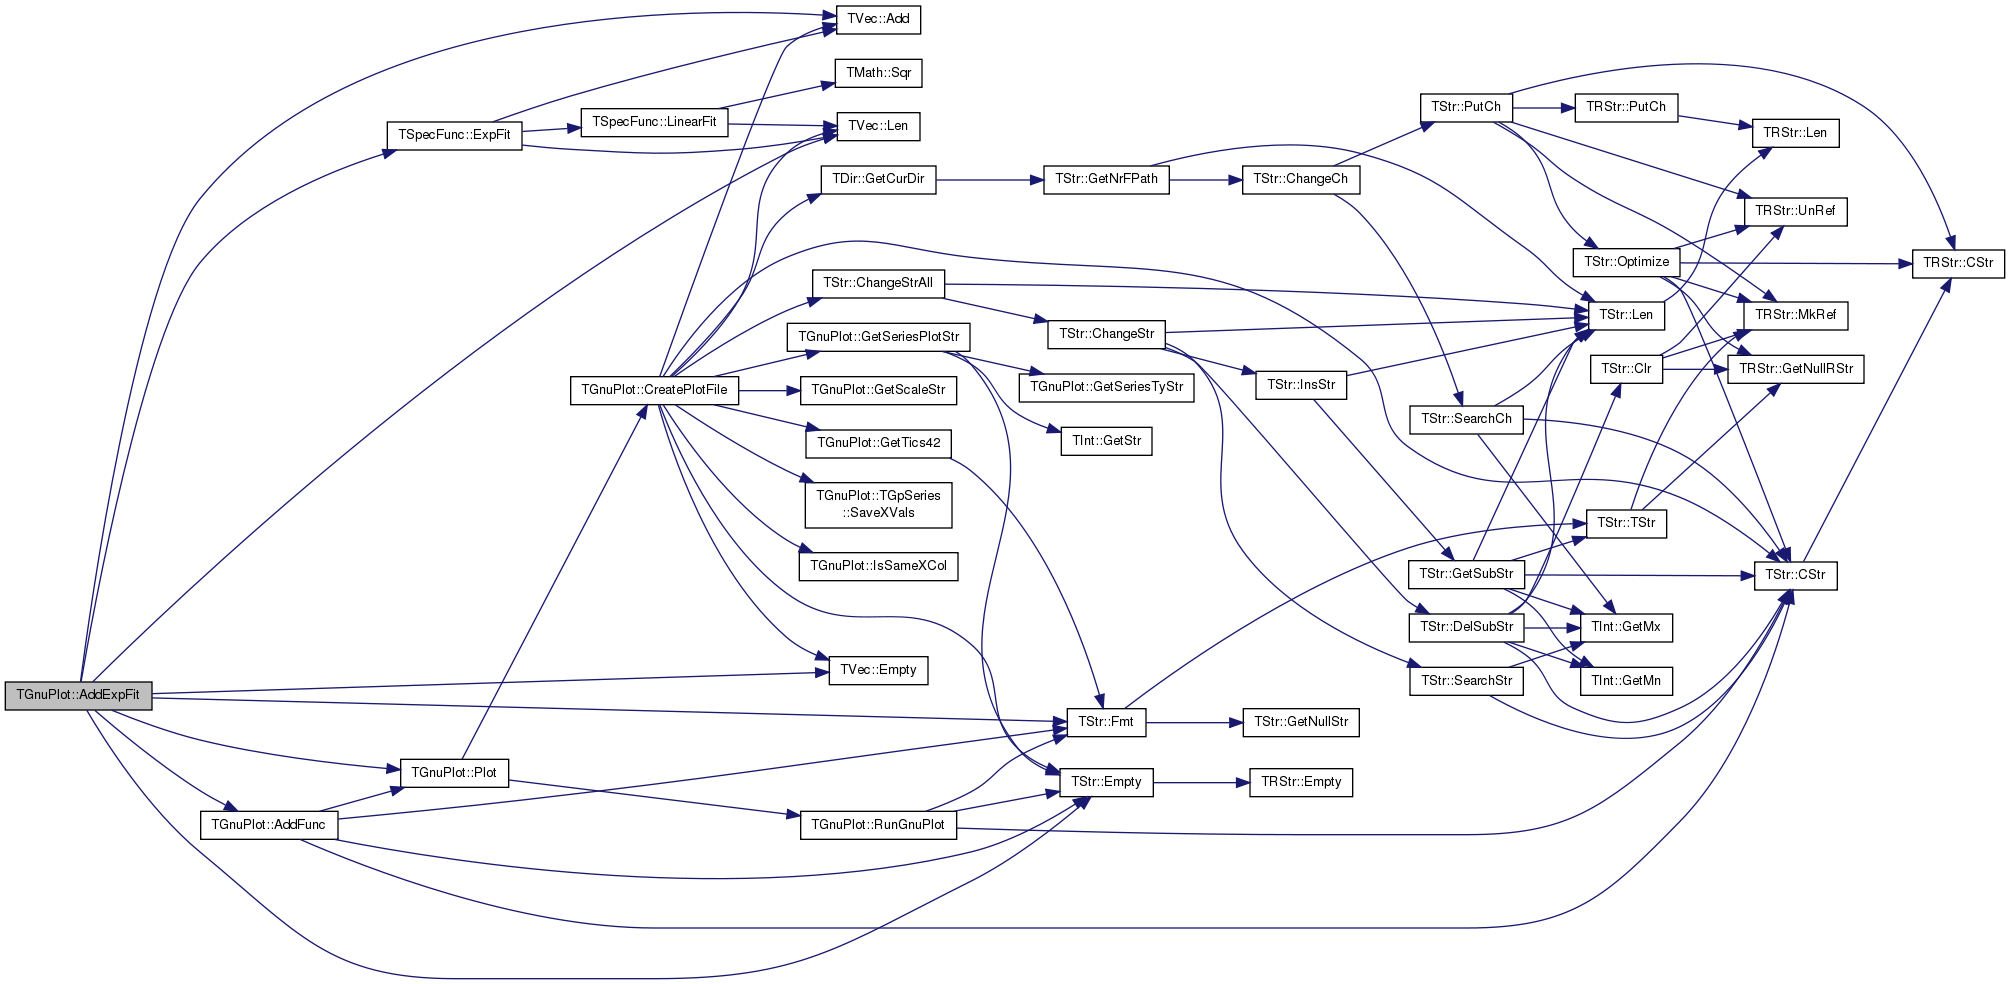
| int TGnuPlot::AddExpFit | ( | const int & | PlotId, |
| const TGpSeriesTy & | SeriesTy = gpwLines, |
||
| const double & | FitXOffset = 0.0, |
||
| const TStr & | Style = TStr() |
||
| ) |
!! skip zero values
Definition at line 550 of file gnuplot.cpp.
References TVec< TVal, TSizeTy >::Add(), AddFunc(), TStr::Empty(), TVec< TVal, TSizeTy >::Empty(), TSpecFunc::ExpFit(), TStr::Fmt(), TVec< TVal, TSizeTy >::Len(), Plot(), SeriesV, and TGnuPlot::TGpSeries::XYValV.
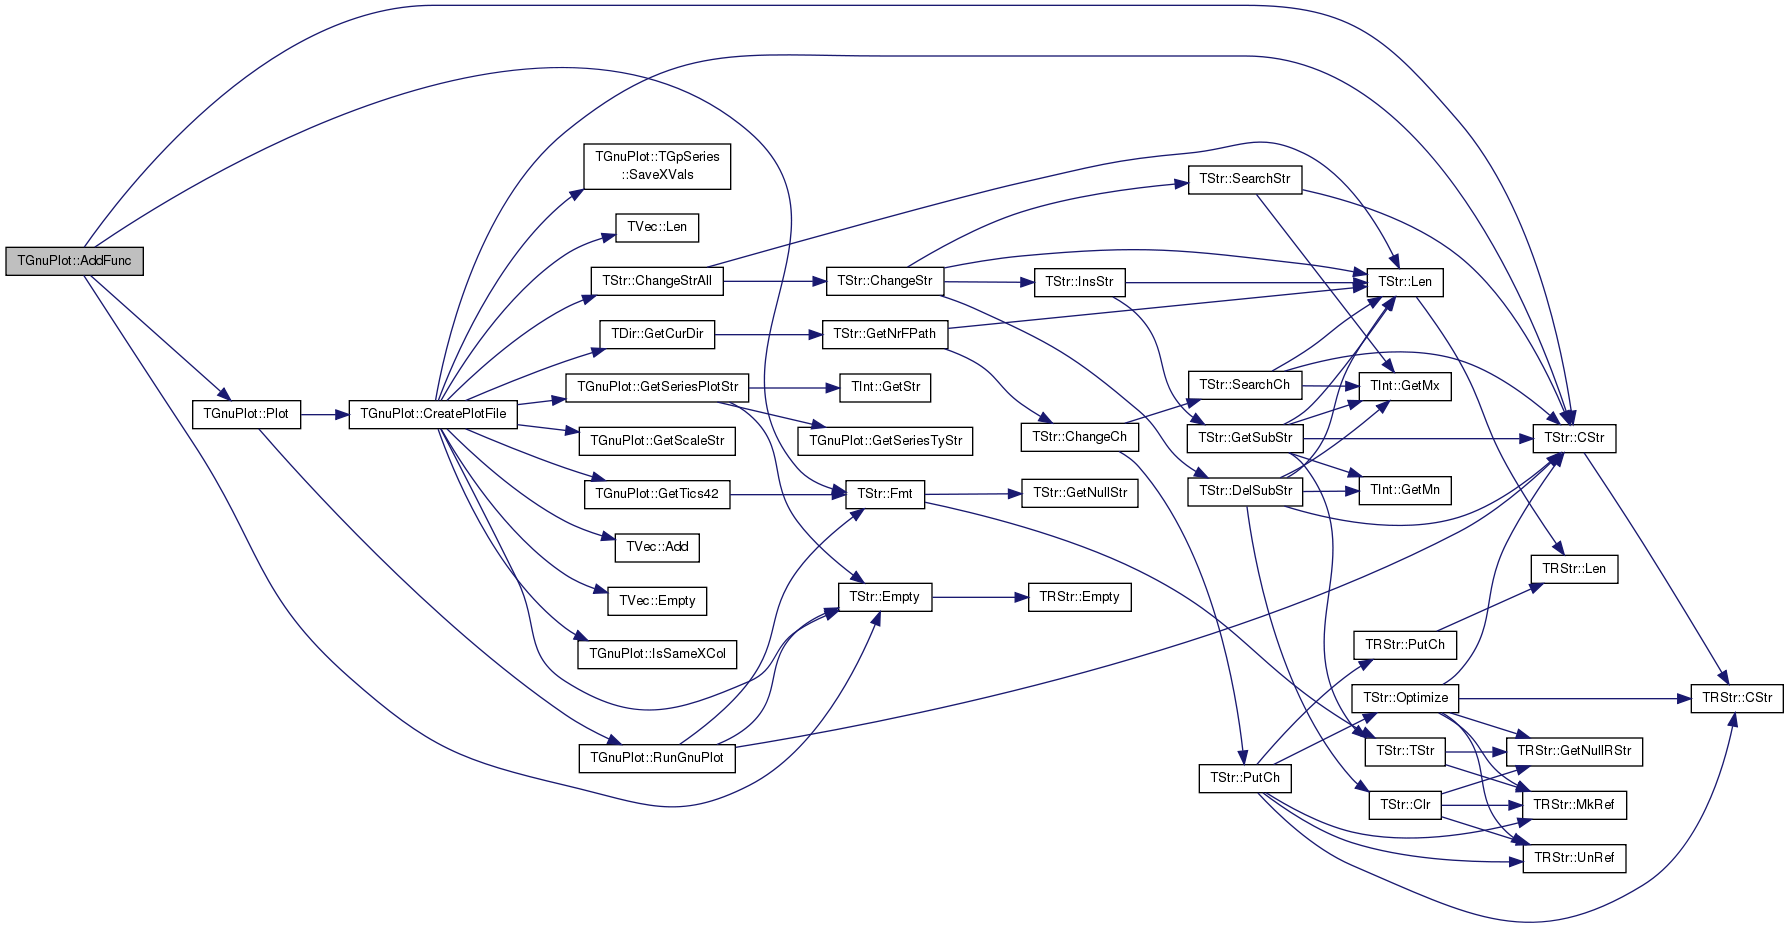
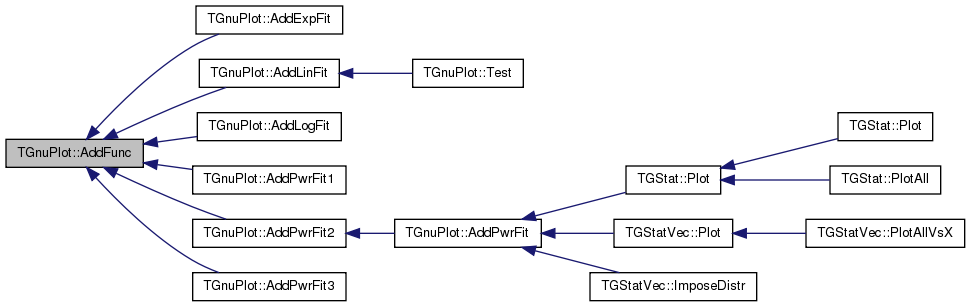
| int TGnuPlot::AddFunc | ( | const TStr & | FuncStr, |
| const TGpSeriesTy & | SeriesTy = gpwLinesPoints, |
||
| const TStr & | Label = TStr(), |
||
| const TStr & | Style = TStr() |
||
| ) |
Definition at line 155 of file gnuplot.cpp.
References TStr::CStr(), TGnuPlot::TGpSeries::DataFNm, TStr::Empty(), TStr::Fmt(), TGnuPlot::TGpSeries::Label, Plot(), TGnuPlot::TGpSeries::SeriesTy, SeriesV, TGnuPlot::TGpSeries::WithStyle, and TGnuPlot::TGpSeries::XCol.
Referenced by AddExpFit(), AddLinFit(), AddLogFit(), AddPwrFit1(), AddPwrFit2(), and AddPwrFit3().
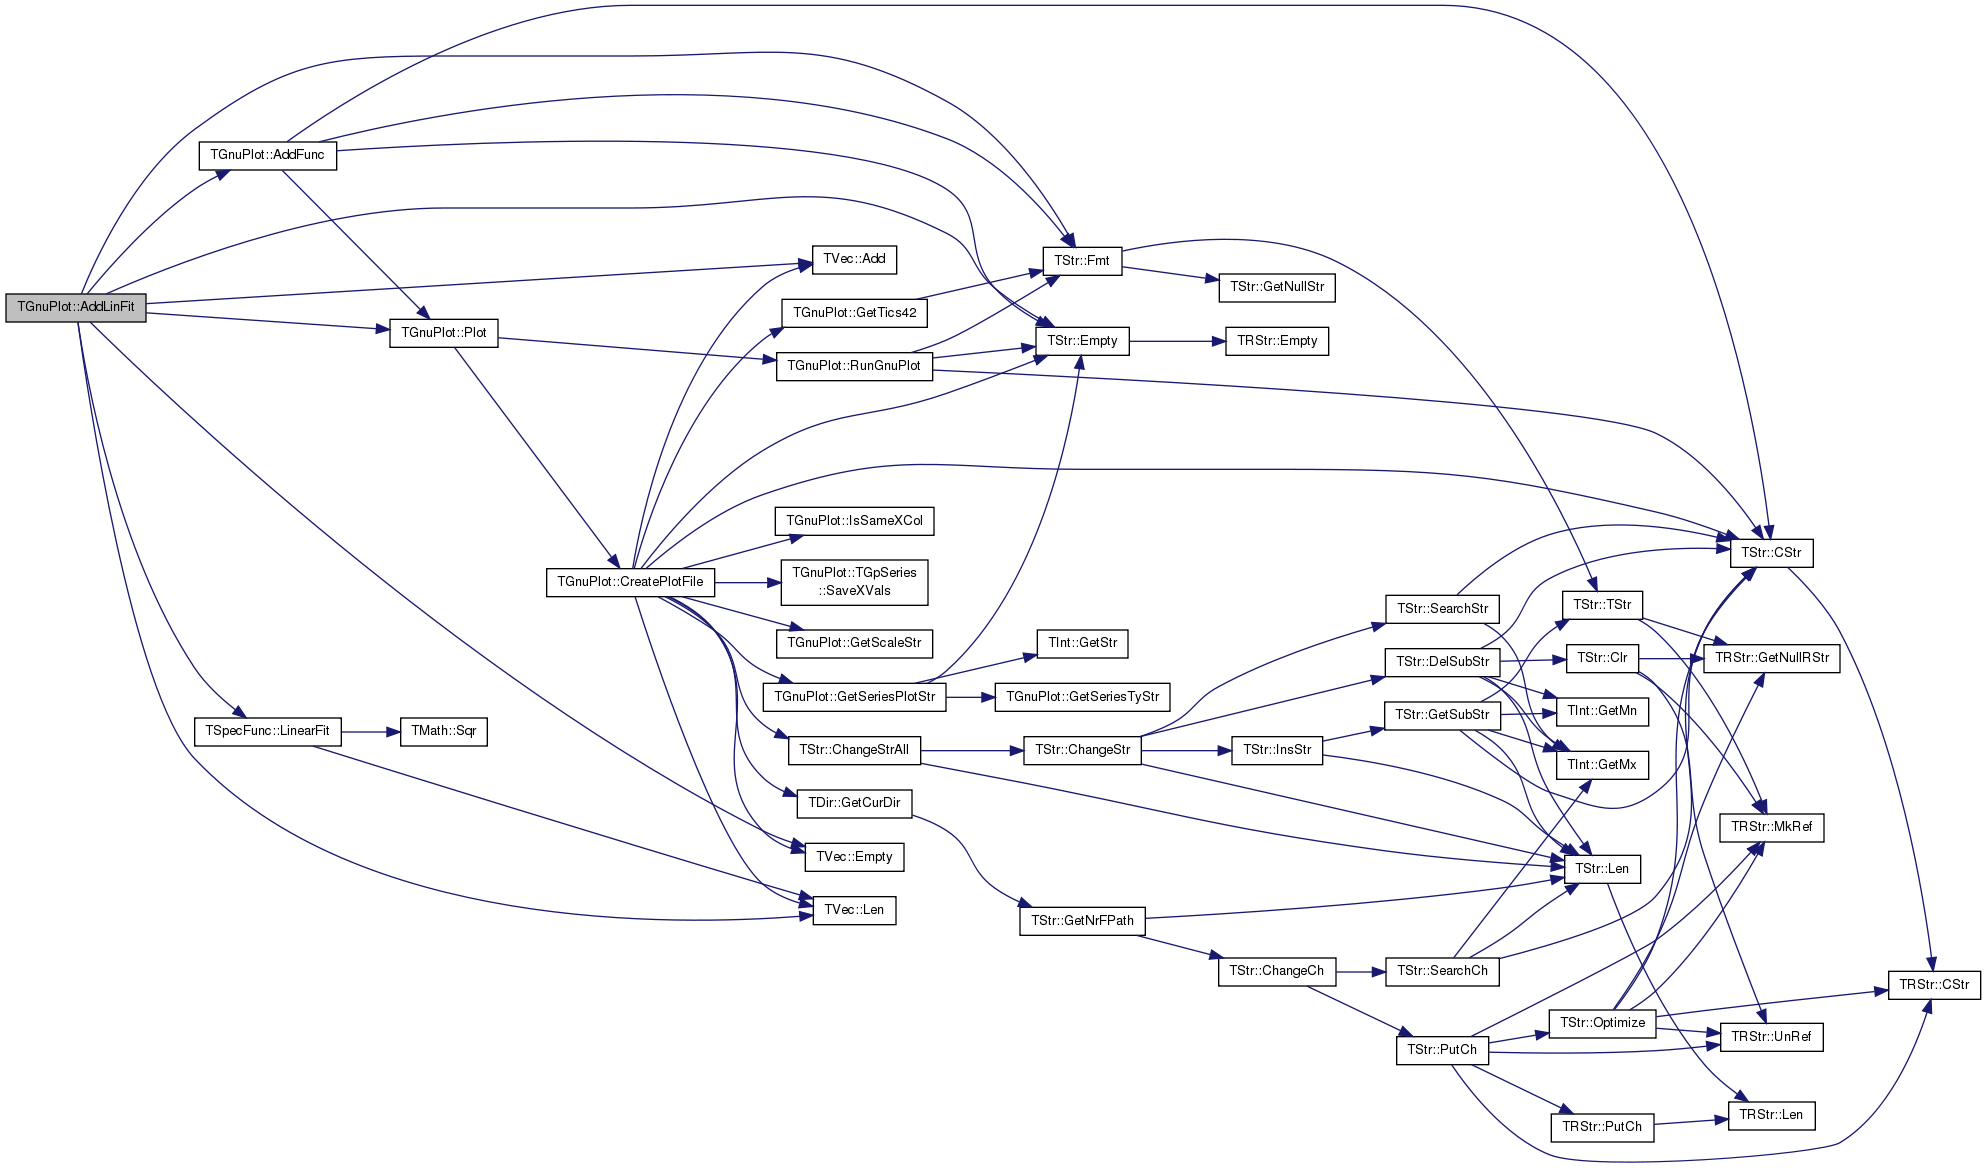
| int TGnuPlot::AddLinFit | ( | const int & | PlotId, |
| const TGpSeriesTy & | SeriesTy = gpwLines, |
||
| const TStr & | Style = TStr() |
||
| ) |
Definition at line 339 of file gnuplot.cpp.
References TVec< TVal, TSizeTy >::Add(), AddFunc(), TStr::Empty(), TVec< TVal, TSizeTy >::Empty(), TStr::Fmt(), TVec< TVal, TSizeTy >::Len(), TSpecFunc::LinearFit(), Plot(), SeriesV, and TGnuPlot::TGpSeries::XYValV.
Referenced by Test().

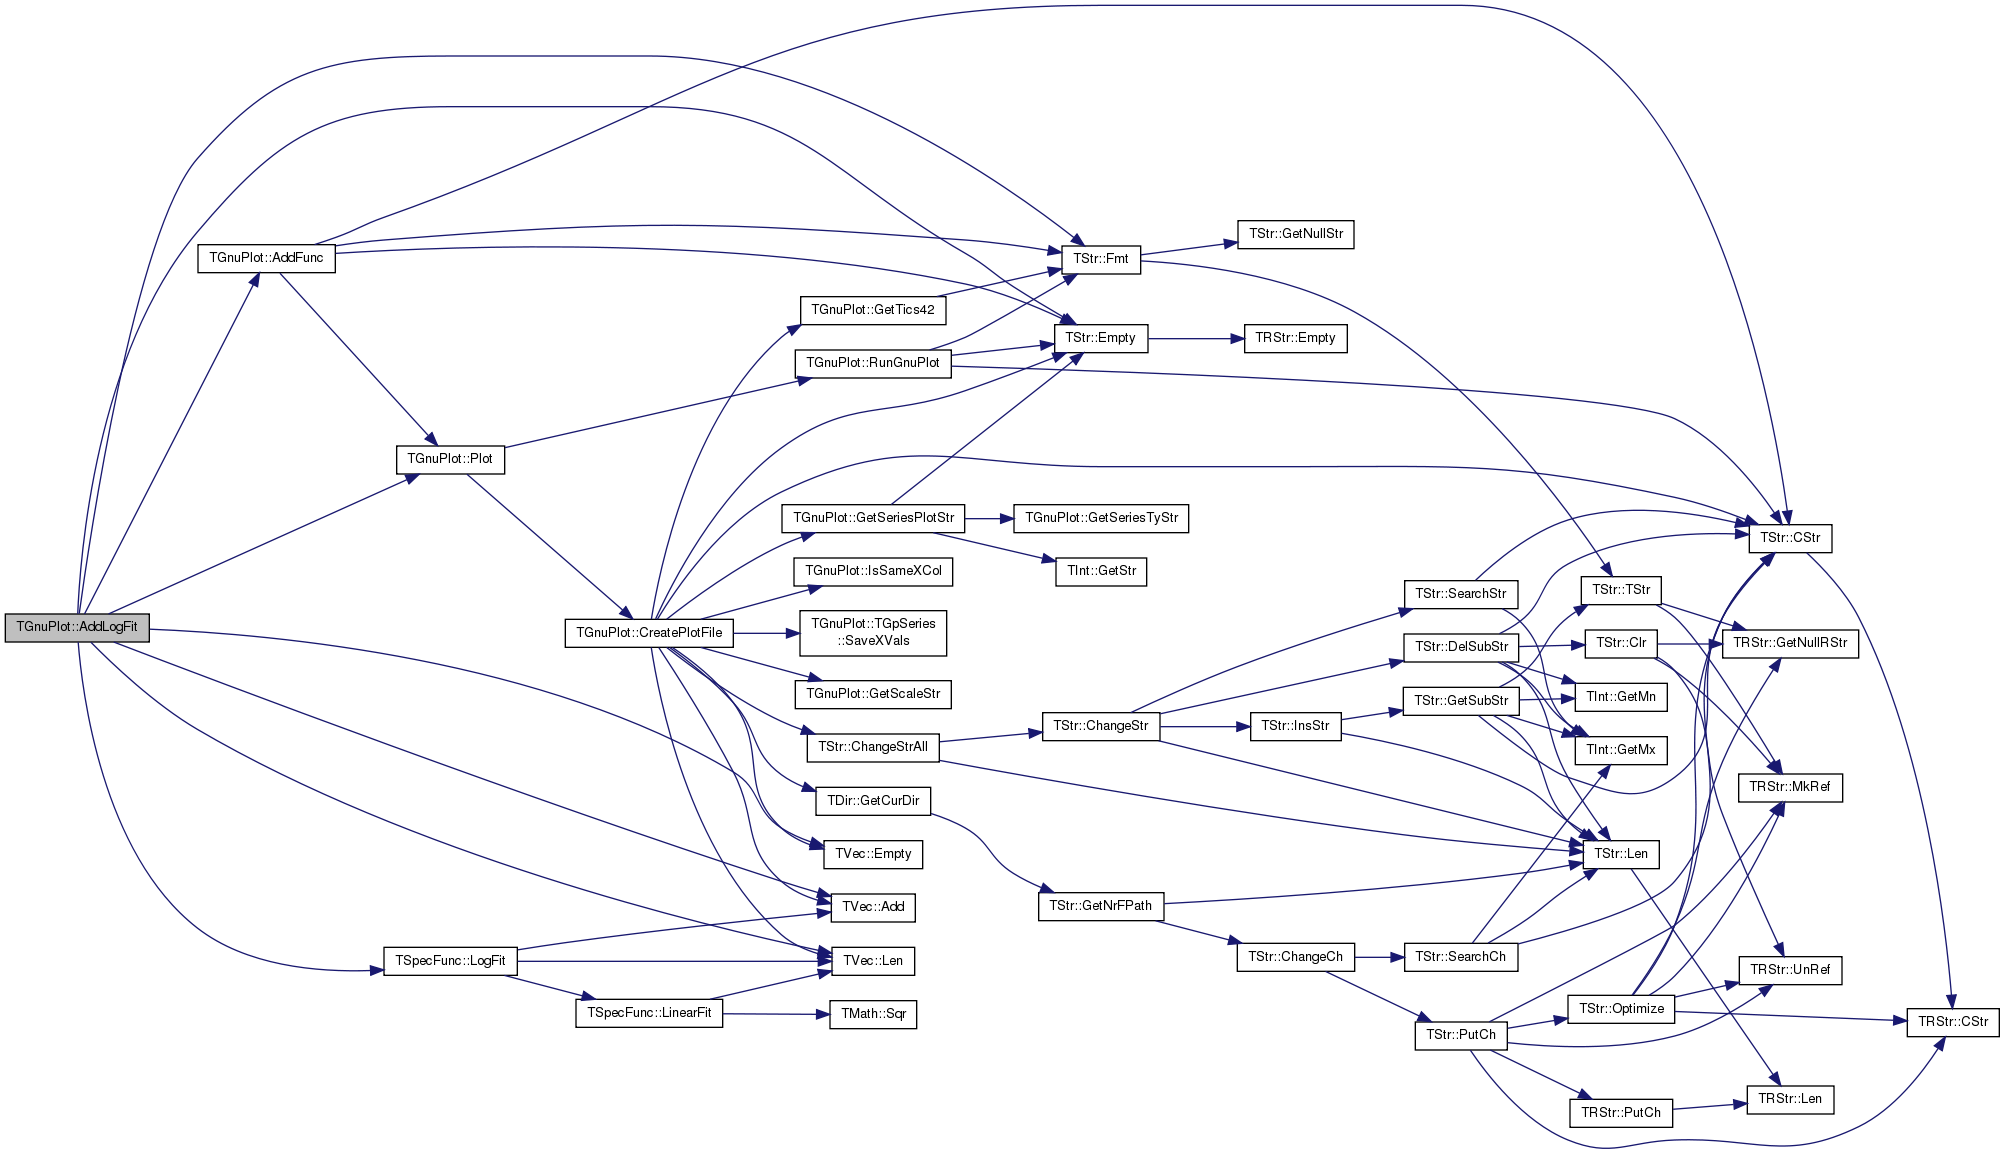
| int TGnuPlot::AddLogFit | ( | const int & | PlotId, |
| const TGpSeriesTy & | SeriesTy = gpwLines, |
||
| const TStr & | Style = TStr() |
||
| ) |
!! skip zero values
Definition at line 519 of file gnuplot.cpp.
References TVec< TVal, TSizeTy >::Add(), AddFunc(), TStr::Empty(), TVec< TVal, TSizeTy >::Empty(), TStr::Fmt(), TVec< TVal, TSizeTy >::Len(), TSpecFunc::LogFit(), Plot(), SeriesV, and TGnuPlot::TGpSeries::XYValV.
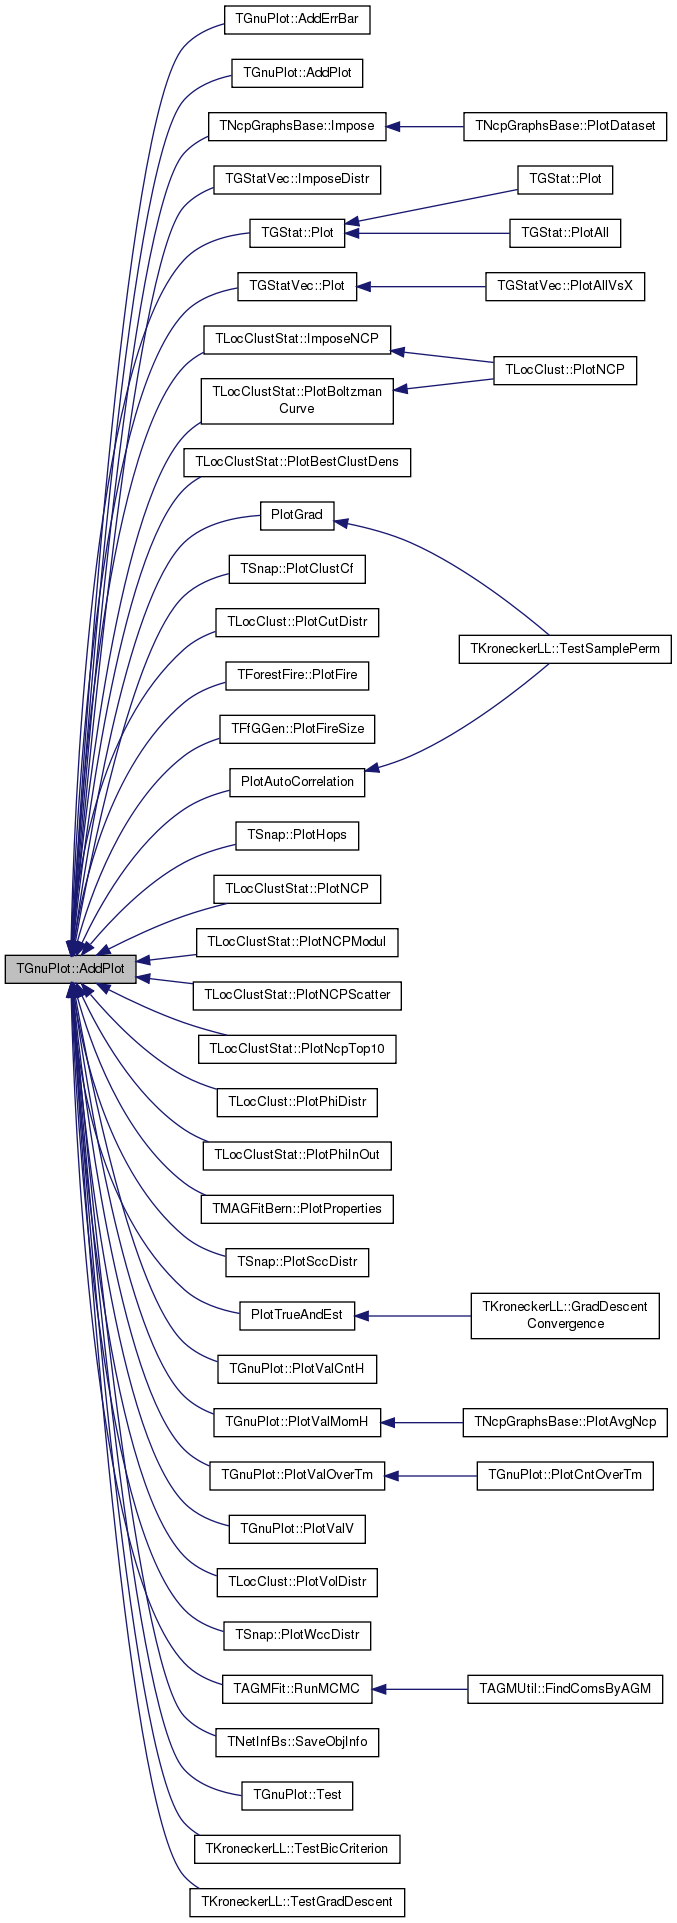
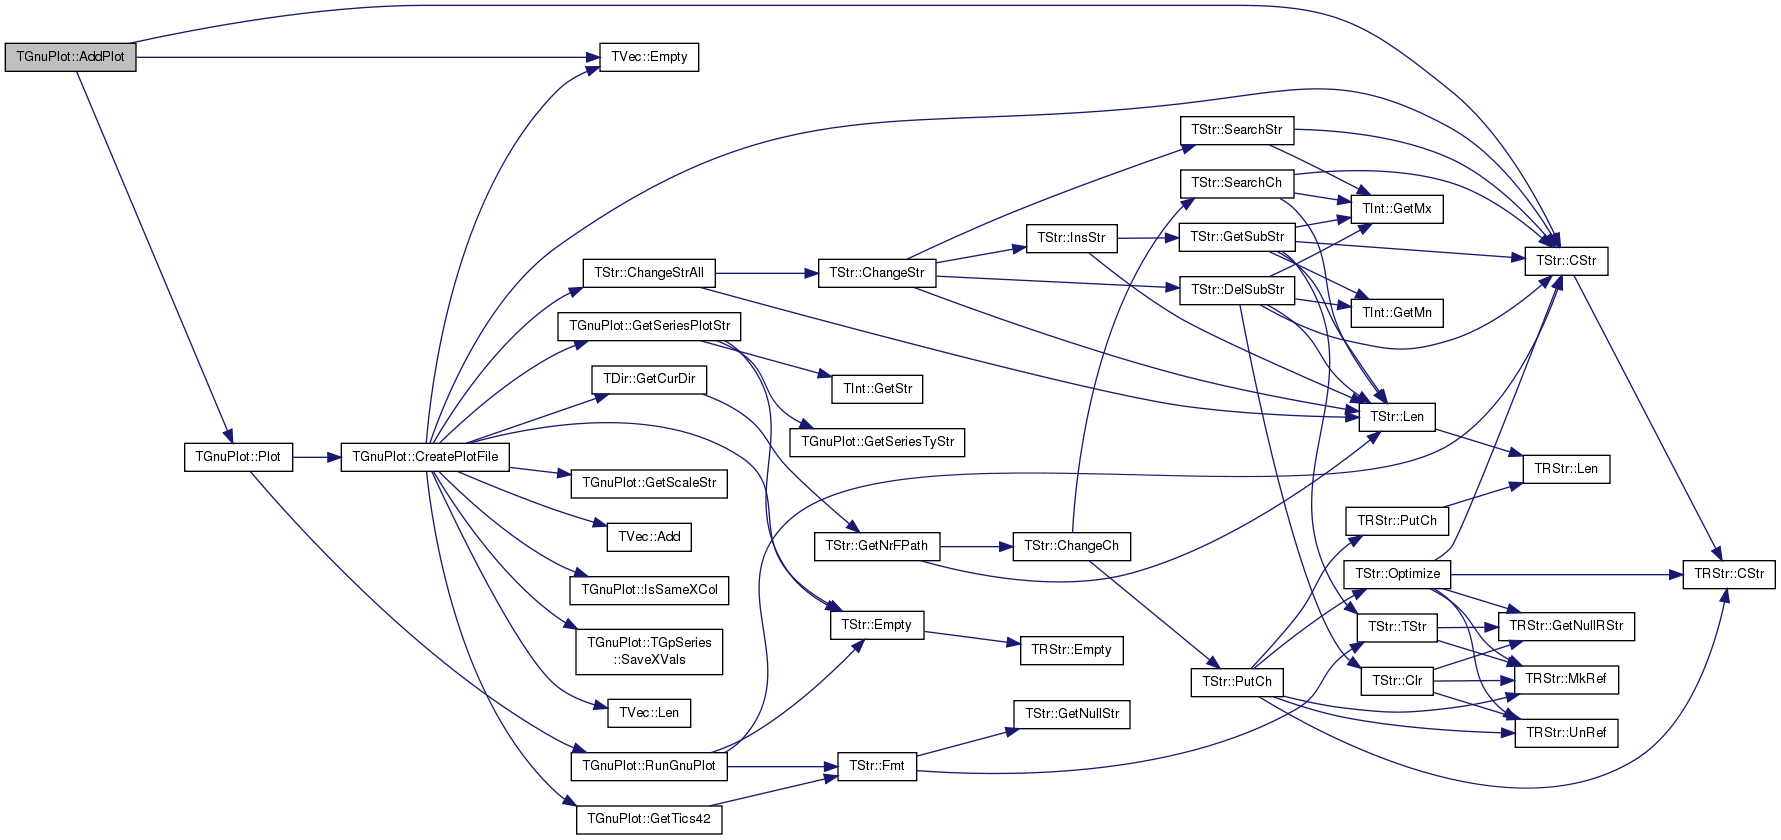
| int TGnuPlot::AddPlot | ( | const TIntV & | YValV, |
| const TGpSeriesTy & | SeriesTy = gpwLinesPoints, |
||
| const TStr & | Label = TStr(), |
||
| const TStr & | Style = TStr() |
||
| ) |
Definition at line 186 of file gnuplot.cpp.
References TVec< TVal, TSizeTy >::Add(), and TVec< TVal, TSizeTy >::Len().
Referenced by AddErrBar(), AddPlot(), TNcpGraphsBase::Impose(), TGStatVec::ImposeDistr(), TLocClustStat::ImposeNCP(), TGStat::Plot(), TGStatVec::Plot(), PlotAutoCorrelation(), TLocClustStat::PlotBestClustDens(), TLocClustStat::PlotBoltzmanCurve(), TSnap::PlotClustCf(), TLocClust::PlotCutDistr(), TForestFire::PlotFire(), TFfGGen::PlotFireSize(), PlotGrad(), TSnap::PlotHops(), TLocClustStat::PlotNCP(), TLocClustStat::PlotNCPModul(), TLocClustStat::PlotNCPScatter(), TLocClustStat::PlotNcpTop10(), TLocClust::PlotPhiDistr(), TLocClustStat::PlotPhiInOut(), TMAGFitBern::PlotProperties(), TSnap::PlotSccDistr(), PlotTrueAndEst(), PlotValCntH(), PlotValMomH(), PlotValOverTm(), PlotValV(), TLocClust::PlotVolDistr(), TSnap::PlotWccDistr(), TAGMFit::RunMCMC(), TNetInfBs::SaveObjInfo(), Test(), TKroneckerLL::TestBicCriterion(), and TKroneckerLL::TestGradDescent().
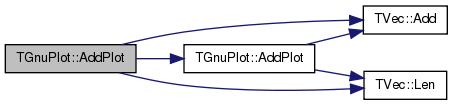
| int TGnuPlot::AddPlot | ( | const TFltV & | YValV, |
| const TGpSeriesTy & | SeriesTy = gpwLinesPoints, |
||
| const TStr & | Label = TStr(), |
||
| const TStr & | Style = TStr() |
||
| ) |
Definition at line 194 of file gnuplot.cpp.
References TVec< TVal, TSizeTy >::Add(), AddPlot(), and TVec< TVal, TSizeTy >::Len().

| int TGnuPlot::AddPlot | ( | const TFltV & | XValV, |
| const TFltV & | YValV, | ||
| const TGpSeriesTy & | SeriesTy = gpwLinesPoints, |
||
| const TStr & | Label = TStr(), |
||
| const TStr & | Style = TStr() |
||
| ) |
Definition at line 202 of file gnuplot.cpp.
References TVec< TVal, TSizeTy >::Add(), AddPlot(), IAssert, and TVec< TVal, TSizeTy >::Len().

| int TGnuPlot::AddPlot | ( | const TIntPrV & | XYValV, |
| const TGpSeriesTy & | SeriesTy = gpwLinesPoints, |
||
| const TStr & | Label = TStr(), |
||
| const TStr & | Style = TStr() |
||
| ) |
Definition at line 211 of file gnuplot.cpp.
References TVec< TVal, TSizeTy >::Add(), AddPlot(), and TVec< TVal, TSizeTy >::Len().

| int TGnuPlot::AddPlot | ( | const TFltPrV & | XYValV, |
| const TGpSeriesTy & | SeriesTy = gpwLinesPoints, |
||
| const TStr & | Label = TStr(), |
||
| const TStr & | Style = TStr() |
||
| ) |
Definition at line 219 of file gnuplot.cpp.
References TVec< TVal, TSizeTy >::Add(), AddPlot(), and TVec< TVal, TSizeTy >::Len().

| int TGnuPlot::AddPlot | ( | const TIntKdV & | XYValV, |
| const TGpSeriesTy & | SeriesTy = gpwLinesPoints, |
||
| const TStr & | Label = TStr(), |
||
| const TStr & | Style = TStr() |
||
| ) |
Definition at line 227 of file gnuplot.cpp.
References TVec< TVal, TSizeTy >::Add(), AddPlot(), and TVec< TVal, TSizeTy >::Len().

| int TGnuPlot::AddPlot | ( | const TFltKdV & | XYValV, |
| const TGpSeriesTy & | SeriesTy = gpwLinesPoints, |
||
| const TStr & | Label = TStr(), |
||
| const TStr & | Style = TStr() |
||
| ) |
Definition at line 251 of file gnuplot.cpp.
References TStr::CStr(), DataFNm, TVec< TVal, TSizeTy >::Empty(), TGnuPlot::TGpSeries::Label, Plot(), TGnuPlot::TGpSeries::SeriesTy, SeriesV, Title, TGnuPlot::TGpSeries::WithStyle, and TGnuPlot::TGpSeries::XYValV.
| int TGnuPlot::AddPlot | ( | const TIntFltKdV & | XYValV, |
| const TGpSeriesTy & | SeriesTy = gpwLinesPoints, |
||
| const TStr & | Label = TStr(), |
||
| const TStr & | Style = TStr() |
||
| ) |
Definition at line 235 of file gnuplot.cpp.
References TVec< TVal, TSizeTy >::Add(), AddPlot(), and TVec< TVal, TSizeTy >::Len().

| int TGnuPlot::AddPlot | ( | const TIntFltPrV & | XYValV, |
| const TGpSeriesTy & | SeriesTy = gpwLinesPoints, |
||
| const TStr & | Label = TStr(), |
||
| const TStr & | Style = TStr() |
||
| ) |
Definition at line 243 of file gnuplot.cpp.
References TVec< TVal, TSizeTy >::Add(), AddPlot(), and TVec< TVal, TSizeTy >::Len().
| int TGnuPlot::AddPlot | ( | const TStr & | DataFNm, |
| const int & | ColY, | ||
| const TGpSeriesTy & | SeriesTy = gpwLinesPoints, |
||
| const TStr & | Label = TStr(), |
||
| const TStr & | Style = TStr() |
||
| ) |
Definition at line 168 of file gnuplot.cpp.
References AddPlot().

| int TGnuPlot::AddPlot | ( | const TStr & | DataFNm, |
| const int & | ColX, | ||
| const int & | ColY, | ||
| const TGpSeriesTy & | SeriesTy = gpwLinesPoints, |
||
| const TStr & | Label = TStr(), |
||
| const TStr & | Style = TStr() |
||
| ) |
Definition at line 173 of file gnuplot.cpp.
References TStr::ChangeStrAll(), TGnuPlot::TGpSeries::DataFNm, DataFNm, IAssert, TGnuPlot::TGpSeries::Label, Plot(), TGnuPlot::TGpSeries::SeriesTy, SeriesV, TGnuPlot::TGpSeries::WithStyle, TGnuPlot::TGpSeries::XCol, TGnuPlot::TGpSeries::YCol, and TGnuPlot::TGpSeries::ZCol.
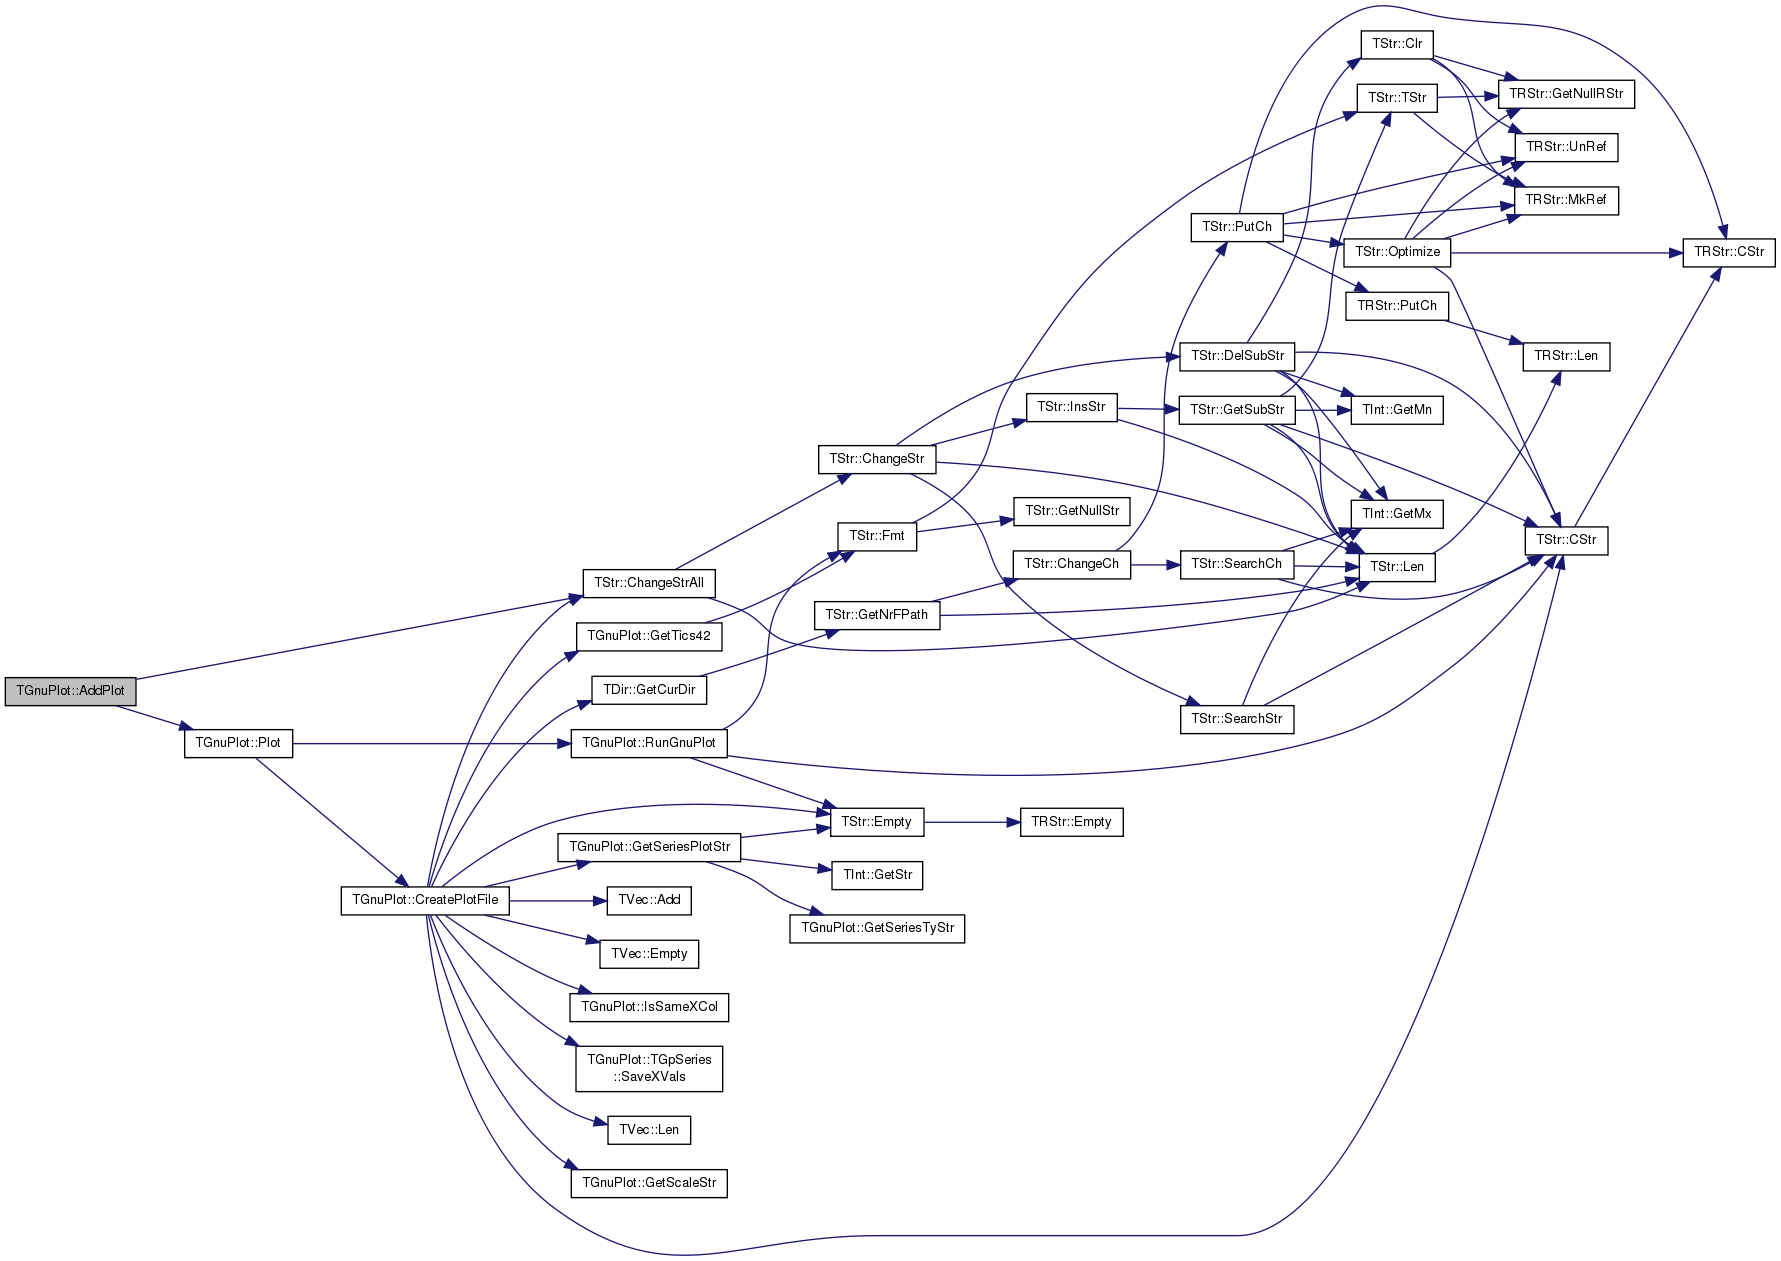
| int TGnuPlot::AddPlot | ( | const THash< TKey, TDat, THashFunc > & | XYValH, |
| const TGpSeriesTy & | SeriesTy = gpwLinesPoints, |
||
| const TStr & | Label = TStr(), |
||
| const TStr & | Style = TStr(), |
||
| const bool & | ExpBucket = false |
||
| ) |
Definition at line 260 of file gnuplot.h.
References TVec< TVal, TSizeTy >::Add(), AddPlot(), THash< TKey, TDat, THashFunc >::FFirstKeyId(), THash< TKey, TDat, THashFunc >::FNextKeyId(), THash< TKey, TDat, THashFunc >::GetKey(), THash< TKey, TDat, THashFunc >::Len(), MakeExpBins(), and TVec< TVal, TSizeTy >::Swap().
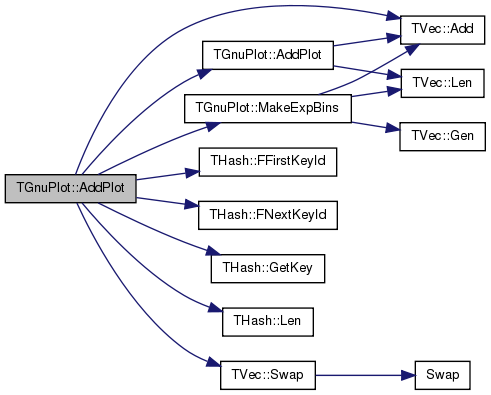
| int TGnuPlot::AddPlot | ( | const THash< TKey, TMom, THashFunc > & | ValMomH, |
| const TGpSeriesTy & | SeriesTy = gpwLinesPoints, |
||
| const TStr & | Label = TStr(), |
||
| const TStr & | Style = TStr(), |
||
| bool | PlotAvg = true, |
||
| bool | PlotMed = true, |
||
| bool | PlotMin = false, |
||
| bool | PlotMax = false, |
||
| bool | PlotSDev = false, |
||
| bool | PlotStdErr = false, |
||
| const bool & | ExpBucket = false |
||
| ) |
Definition at line 275 of file gnuplot.h.
References TVec< TVal, TSizeTy >::Add(), AddErrBar(), AddPlot(), TMom::Def(), TVec< TVal, TSizeTy >::Empty(), THash< TKey, TDat, THashFunc >::FFirstKeyId(), THash< TKey, TDat, THashFunc >::FNextKeyId(), THash< TKey, TDat, THashFunc >::GetKey(), TMom::GetMean(), TMom::GetMedian(), TMom::GetMn(), TMom::GetMx(), TMom::GetSDev(), TMom::GetVals(), TMom::IsDef(), MakeExpBins(), TVec< TVal, TSizeTy >::Sort(), and TVec< TVal, TSizeTy >::Swap().
| int TGnuPlot::AddPwrFit | ( | const int & | PlotId, |
| const TGpSeriesTy & | SeriesTy = gpwLines, |
||
| const TStr & | Style = TStr() |
||
| ) |
Definition at line 370 of file gnuplot.cpp.
References AddPwrFit2(), and AddPwrFit3().
Referenced by TGStatVec::ImposeDistr(), TGStat::Plot(), and TGStatVec::Plot().
| int TGnuPlot::AddPwrFit1 | ( | const int & | PlotId, |
| const TGpSeriesTy & | SeriesTy = gpwLines, |
||
| const TStr & | Style = TStr() |
||
| ) |
!! skip zero values
Definition at line 377 of file gnuplot.cpp.
References TVec< TVal, TSizeTy >::Add(), AddFunc(), TStr::Empty(), TVec< TVal, TSizeTy >::Empty(), TStr::Fmt(), TVec< TVal, TSizeTy >::Len(), TMath::Mn(), TFlt::Mx, Plot(), TSpecFunc::PowerFit(), SeriesV, and TGnuPlot::TGpSeries::XYValV.
| int TGnuPlot::AddPwrFit2 | ( | const int & | PlotId, |
| const TGpSeriesTy & | SeriesTy = gpwLines, |
||
| const double & | MinX = -1.0, |
||
| const TStr & | Style = TStr() |
||
| ) |
Definition at line 419 of file gnuplot.cpp.
References TVec< TVal, TSizeTy >::Add(), AddFunc(), TStr::Empty(), TVec< TVal, TSizeTy >::Empty(), TStr::Fmt(), TSpecFunc::GetPowerCoef(), TVec< TVal, TSizeTy >::Len(), TMath::Mn(), TFlt::Mx, Plot(), TSpecFunc::PowerFit(), SeriesV, and TGnuPlot::TGpSeries::XYValV.
Referenced by AddPwrFit().
| int TGnuPlot::AddPwrFit3 | ( | const int & | PlotId, |
| const TGpSeriesTy & | SeriesTy = gpwLines, |
||
| const double & | MinX = -1.0, |
||
| const TStr & | Style = TStr() |
||
| ) |
Definition at line 467 of file gnuplot.cpp.
Referenced by AddPwrFit(), and PlotValV().
| int TGnuPlot::AddPwrFit3 | ( | const int & | PlotId, |
| const TGpSeriesTy & | SeriesTy, | ||
| const double & | MinX, | ||
| const TStr & | Style, | ||
| double & | Intercept, | ||
| double & | Slope, | ||
| double & | R2 | ||
| ) |
!! skip zero values
Definition at line 473 of file gnuplot.cpp.
References TVec< TVal, TSizeTy >::Add(), AddFunc(), TVec< TVal, TSizeTy >::Clr(), TStr::Empty(), TVec< TVal, TSizeTy >::Empty(), TStr::Fmt(), TVec< TVal, TSizeTy >::Last(), TVec< TVal, TSizeTy >::Len(), TMath::Mn(), TFlt::Mx, Plot(), TSpecFunc::PowerFit(), SeriesV, TVec< TVal, TSizeTy >::Swap(), TPair< TVal1, TVal2 >::Val1, and TGnuPlot::TGpSeries::XYValV.
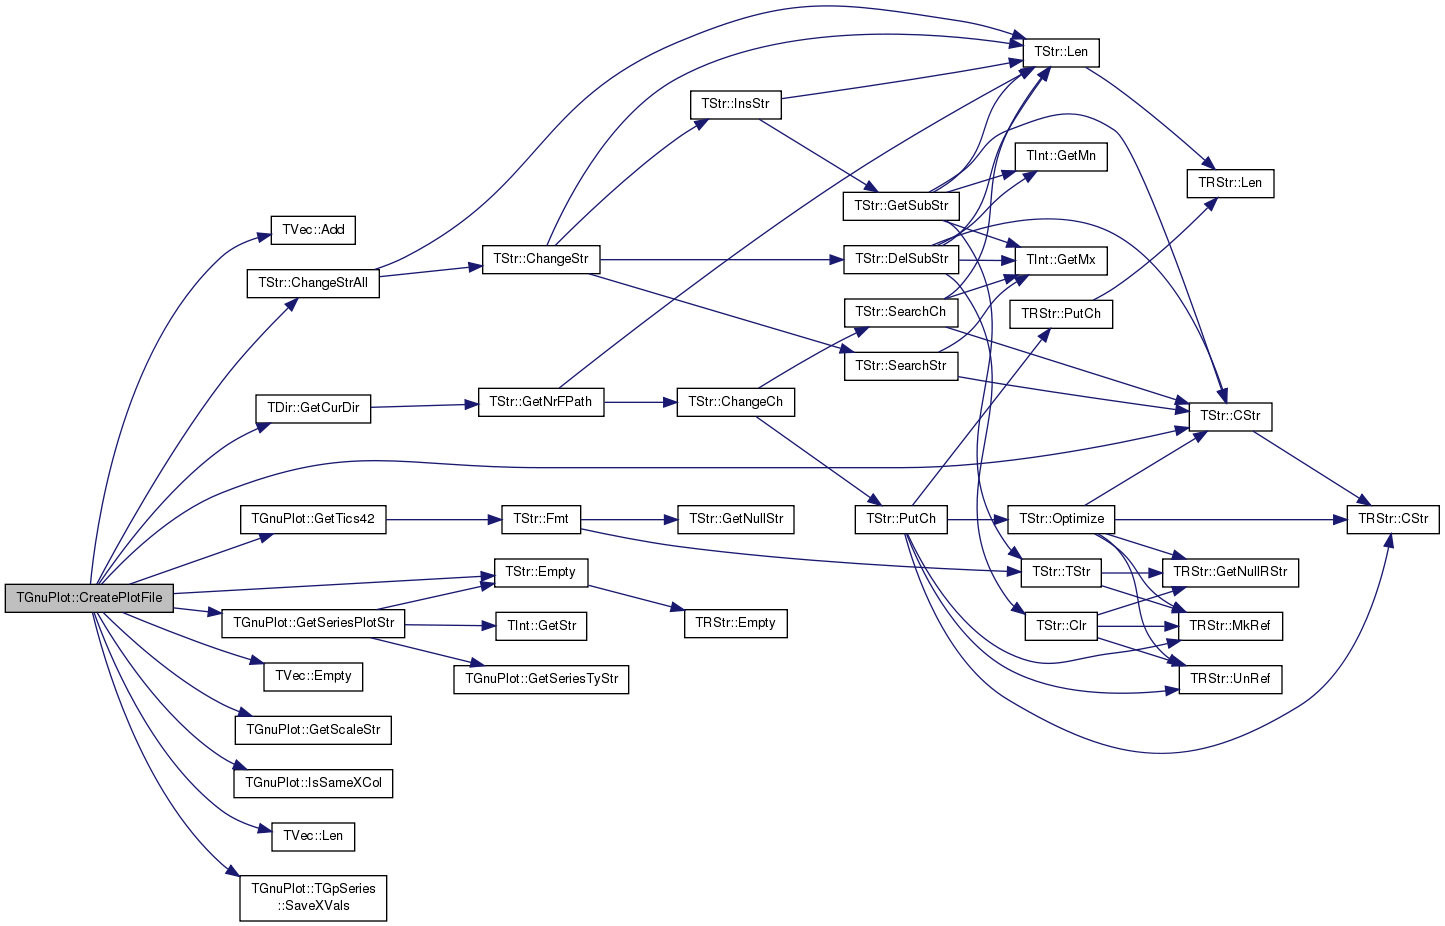
Definition at line 768 of file gnuplot.cpp.
References TVec< TVal, TSizeTy >::Add(), TStr::ChangeStrAll(), TStr::CStr(), TGnuPlot::TGpSeries::DataFNm, DataFNm, EAssertR, TStr::Empty(), TVec< TVal, TSizeTy >::Empty(), TDir::GetCurDir(), GetScaleStr(), GetSeriesPlotStr(), GetTics42(), gpsLog, gpsLog10X, gpsLog10XY, gpsLog10Y, gpsLog2X, gpsLog2XY, gpsLog2Y, IsSameXCol(), TGnuPlot::TGpSeries::Label, LblX, LblY, TVec< TVal, TSizeTy >::Len(), MoreCmds, PlotFNm, TGnuPlot::TGpSeries::SaveXVals(), ScaleTy, SeriesV, SetGrid, SetPause, Tics42, Title, TPair< TVal1, TVal2 >::Val1, TPair< TVal1, TVal2 >::Val2, TGnuPlot::TGpSeries::XCol, XRange, TGnuPlot::TGpSeries::XYValV, TGnuPlot::TGpSeries::YCol, YRange, TGnuPlot::TGpSeries::ZCol, and TGnuPlot::TGpSeries::ZValV.
Referenced by Plot(), SaveEps(), and SavePng().
|
inline |
|
static |
Definition at line 683 of file gnuplot.cpp.
References Fail, gpsAuto, gpsLog, gpsLog10X, gpsLog10XY, gpsLog10Y, gpsLog2X, gpsLog2XY, gpsLog2Y, and gpsNoAuto.
Referenced by CreatePlotFile().

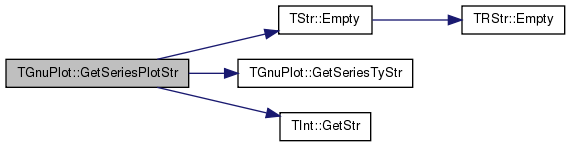
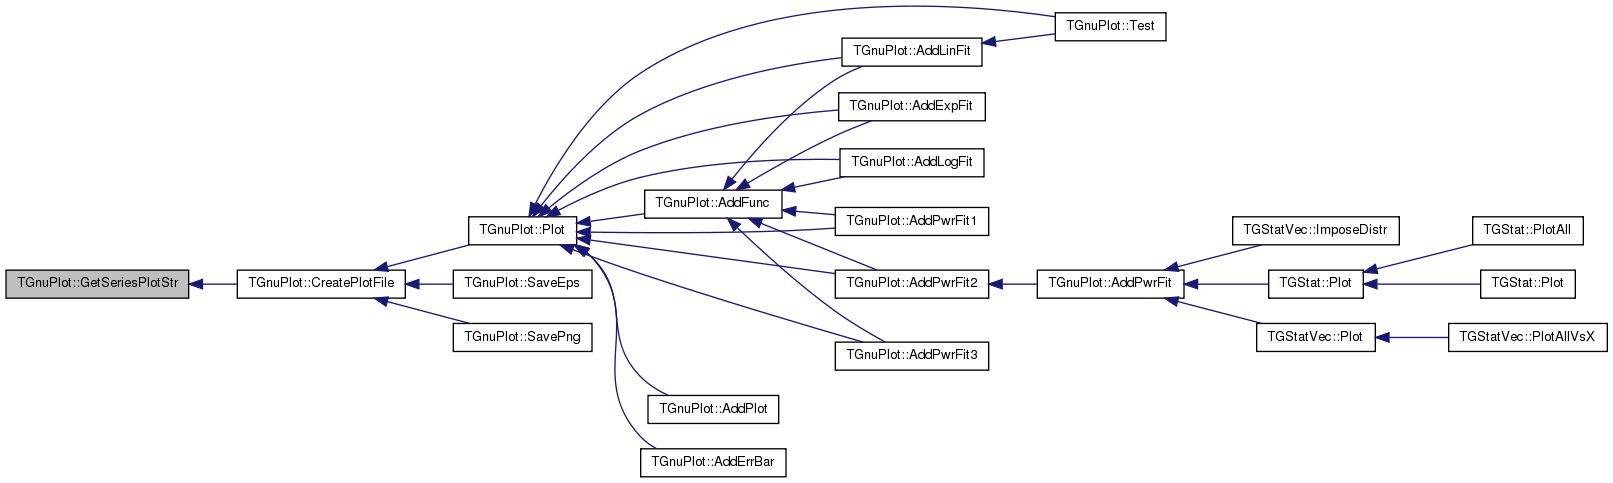
| TStr TGnuPlot::GetSeriesPlotStr | ( | const int & | PlotN | ) |
Definition at line 124 of file gnuplot.cpp.
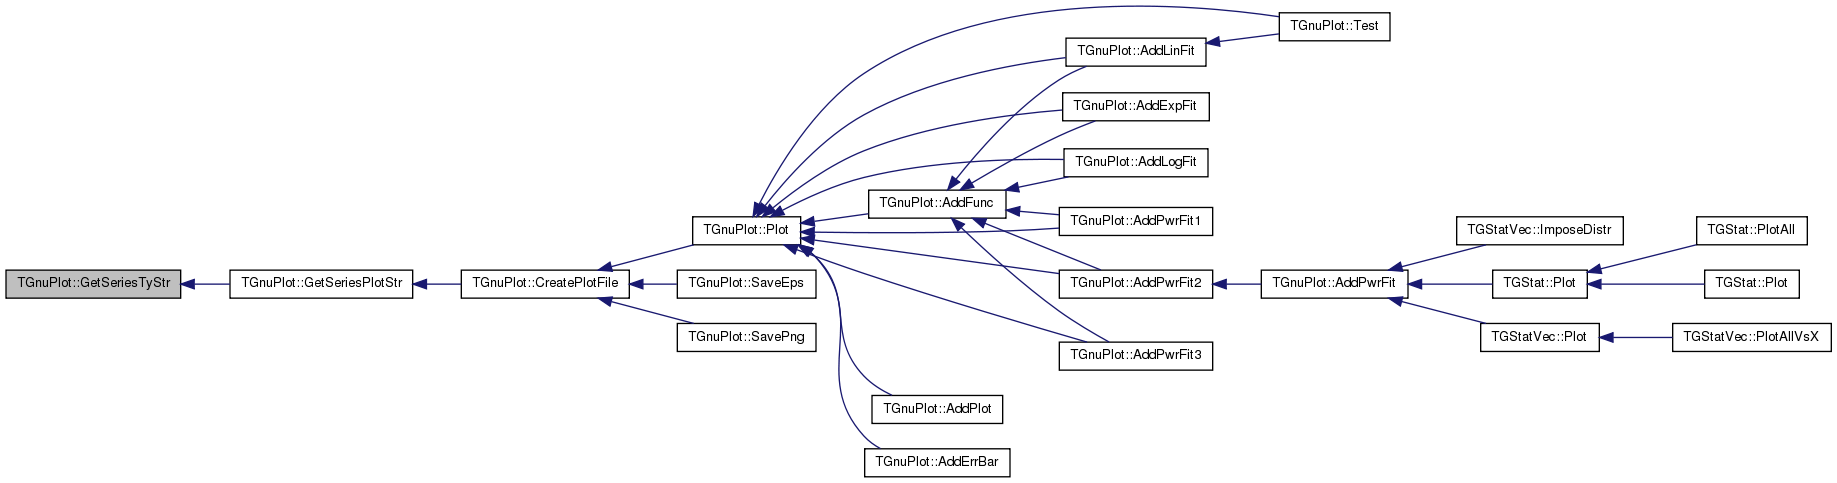
References TGnuPlot::TGpSeries::DataFNm, TStr::Empty(), GetSeriesTyStr(), TInt::GetStr(), gpwBoxes, gpwErrBars, gpwFilledCurves, gpwLines, gpwLinesPoints, gpwPoints, TGnuPlot::TGpSeries::Label, TGnuPlot::TGpSeries::SeriesTy, SeriesV, TGnuPlot::TGpSeries::WithStyle, TGnuPlot::TGpSeries::XCol, TGnuPlot::TGpSeries::YCol, and TGnuPlot::TGpSeries::ZCol.
Referenced by CreatePlotFile().
|
static |
Definition at line 699 of file gnuplot.cpp.
References Fail, gpwBoxes, gpwDots, gpwErrBars, gpwFilledCurves, gpwFSteps, gpwHiSteps, gpwImpulses, gpwLines, gpwLinesPoints, gpwPoints, and gpwSteps.
Referenced by GetSeriesPlotStr().
|
static |
Definition at line 26 of file gnuplot.cpp.
References TStr::Fmt().
Referenced by CreatePlotFile().
| int TGnuPlot::IsSameXCol | ( | const int & | CurId, |
| const int & | PrevId | ||
| ) | const |
Definition at line 758 of file gnuplot.cpp.
References IAssert, and SeriesV.
Referenced by CreatePlotFile().

Definition at line 665 of file gnuplot.cpp.
References TVec< TVal, TSizeTy >::Add(), TVec< TVal, TSizeTy >::Clr(), TPt< TRec >::Empty(), TVec< TVal, TSizeTy >::Gen(), TVec< TVal, TSizeTy >::Len(), TSs::LoadTxt(), and ssfTabSep.
|
static |
Definition at line 614 of file gnuplot.cpp.
References TVec< TVal, TSizeTy >::Add(), TVec< TVal, TSizeTy >::Gen(), and TVec< TVal, TSizeTy >::Len().
Referenced by AddPlot(), TGStatVec::ImposeDistr(), TGUtil::MakeExpBins(), and PlotValCntH().
|
static |
Definition at line 625 of file gnuplot.cpp.
References TVec< TVal, TSizeTy >::Add(), TVec< TVal, TSizeTy >::Clr(), TVec< TVal, TSizeTy >::Empty(), TVec< TVal, TSizeTy >::Gen(), IAssert, TVec< TVal, TSizeTy >::IsSorted(), TKeyDat< TKey, TDat >::Key, TVec< TVal, TSizeTy >::Last(), and TVec< TVal, TSizeTy >::Len().
|
inline |
Definition at line 126 of file gnuplot.h.
References CreatePlotFile(), and RunGnuPlot().
Referenced by AddErrBar(), AddExpFit(), AddFunc(), AddLinFit(), AddLogFit(), AddPlot(), AddPwrFit1(), AddPwrFit2(), AddPwrFit3(), and Test().
|
static |
Definition at line 658 of file gnuplot.h.
References THash< TKey, TDat, THashFunc >::GetKeyDatPrV(), and PlotValOverTm().
|
static |
Definition at line 434 of file gnuplot.h.
References TVec< TVal, TSizeTy >::Add(), THash< TKey, TDat, THashFunc >::FFirstKeyId(), THash< TKey, TDat, THashFunc >::FNextKeyId(), THash< TKey, TDat, THashFunc >::GetKey(), THash< TKey, TDat, THashFunc >::Len(), TVec< TVal, TSizeTy >::Len(), MakeExpBins(), and PlotValV().
Referenced by TLocClust::DrawWhiskers(), TLocClustStat::PlotBoltzmanCurve(), TLocClustStat::PlotPhiDistr(), and PlotValCntH().
|
static |
Definition at line 457 of file gnuplot.h.
References PlotValCntH().
|
static |
Definition at line 466 of file gnuplot.h.
References TVec< TVal, TSizeTy >::Add(), AddPlot(), THash< TKey, TDat, THashFunc >::FFirstKeyId(), THash< TKey, TDat, THashFunc >::FNextKeyId(), THash< TKey, TDat, THashFunc >::GetKey(), THash< TKey, TDat, THashFunc >::Len(), SavePng(), SetScale(), and SetXYLabel().
|
static |
Definition at line 491 of file gnuplot.h.
References TVec< TVal, TSizeTy >::Add(), AddErrBar(), THashSet< TKey, THashFunc >::AddKey(), AddPlot(), TMom::Def(), TVec< TVal, TSizeTy >::Empty(), THash< TKey, TDat, THashFunc >::FFirstKeyId(), THash< TKey, TDat, THashFunc >::FNextKeyId(), THash< TKey, TDat, THashFunc >::GetKey(), TMom::GetMean(), TMom::GetMedian(), TMom::GetMn(), TMom::GetMx(), TMom::GetSDev(), TMom::GetVals(), gpwPoints, TMom::IsDef(), THashSet< TKey, THashFunc >::Len(), SavePng(), SetScale(), SetXYLabel(), and TVec< TVal, TSizeTy >::Sort().
Referenced by TNcpGraphsBase::PlotAvgNcp().

|
static |
Definition at line 541 of file gnuplot.h.
References TVec< TVal, TSizeTy >::Add(), AddErrBar(), THashSet< TKey, THashFunc >::AddKey(), AddPlot(), TMom::Def(), TVec< TVal, TSizeTy >::Empty(), THash< TKey, TDat, THashFunc >::FFirstKeyId(), THash< TKey, TDat, THashFunc >::FNextKeyId(), THash< TKey, TDat, THashFunc >::GetKey(), TMom::GetMean(), TMom::GetMedian(), TMom::GetMn(), TMom::GetMx(), TMom::GetSDev(), TMom::GetVals(), gpwPoints, TMom::IsDef(), THashSet< TKey, THashFunc >::Len(), SavePng(), SetScale(), SetXYLabel(), and TVec< TVal, TSizeTy >::Sort().

|
static |
Definition at line 628 of file gnuplot.h.
References AddCmd(), AddPlot(), TStr::CStr(), DataFNm, TVec< TVal, TSizeTy >::Len(), SavePng(), SetScale(), SetXYLabel(), and TVec< TVal, TSizeTy >::Sort().
Referenced by PlotCntOverTm().

|
static |
Definition at line 420 of file gnuplot.h.
References TVec< TVal, TSizeTy >::Add(), THash< TKey, TDat, THashFunc >::FFirstKeyId(), THash< TKey, TDat, THashFunc >::FNextKeyId(), THash< TKey, TDat, THashFunc >::Len(), and PlotValV().
|
static |
Definition at line 398 of file gnuplot.h.
References TVec< TVal, TSizeTy >::Add(), AddCmd(), AddPlot(), AddPwrFit3(), TStr::CStr(), TStr::Fmt(), TVec< TVal, TSizeTy >::Len(), SavePng(), SetScale(), SetXYLabel(), and Swap().
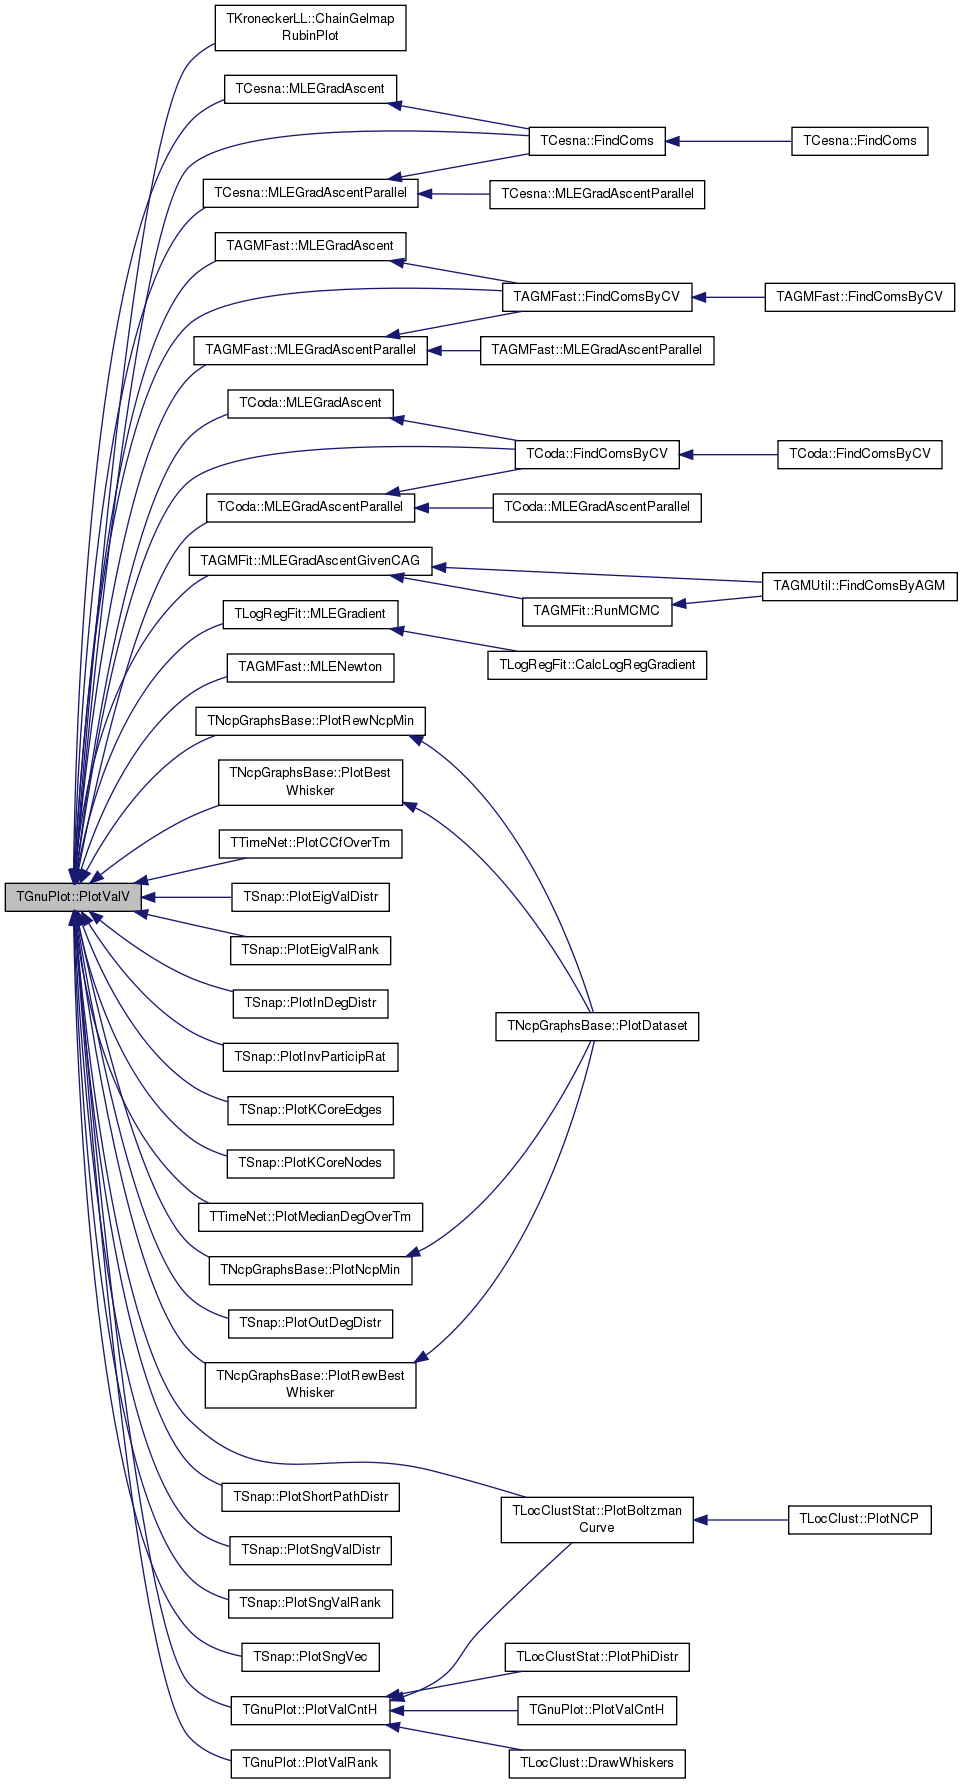
Referenced by TKroneckerLL::ChainGelmapRubinPlot(), TCesna::FindComs(), TAGMFast::FindComsByCV(), TCoda::FindComsByCV(), TAGMFast::MLEGradAscent(), TCoda::MLEGradAscent(), TCesna::MLEGradAscent(), TAGMFit::MLEGradAscentGivenCAG(), TAGMFast::MLEGradAscentParallel(), TCoda::MLEGradAscentParallel(), TCesna::MLEGradAscentParallel(), TLogRegFit::MLEGradient(), TAGMFast::MLENewton(), TNcpGraphsBase::PlotBestWhisker(), TLocClustStat::PlotBoltzmanCurve(), TTimeNet::PlotCCfOverTm(), TSnap::PlotEigValDistr(), TSnap::PlotEigValRank(), TSnap::PlotInDegDistr(), TSnap::PlotInvParticipRat(), TSnap::PlotKCoreEdges(), TSnap::PlotKCoreNodes(), TTimeNet::PlotMedianDegOverTm(), TNcpGraphsBase::PlotNcpMin(), TSnap::PlotOutDegDistr(), TNcpGraphsBase::PlotRewBestWhisker(), TNcpGraphsBase::PlotRewNcpMin(), TSnap::PlotShortPathDistr(), TSnap::PlotSngValDistr(), TSnap::PlotSngValRank(), TSnap::PlotSngVec(), PlotValCntH(), and PlotValRank().
|
static |
Definition at line 316 of file gnuplot.h.
References TVec< TVal, TSizeTy >::Add(), AddCmd(), AddPlot(), AddPwrFit3(), TStr::CStr(), TStr::Fmt(), SavePng(), SetScale(), SetXYLabel(), and Swap().
|
static |
Definition at line 338 of file gnuplot.h.
References TVec< TVal, TSizeTy >::Add(), AddCmd(), AddErrBar(), AddPlot(), AddPwrFit3(), TStr::CStr(), TStr::Fmt(), SavePng(), SetScale(), SetXYLabel(), and Swap().
|
static |
Definition at line 365 of file gnuplot.h.
References TVec< TVal, TSizeTy >::Add(), AddCmd(), AddPlot(), AddPwrFit3(), TStr::CStr(), TStr::Fmt(), SavePng(), SetScale(), SetXYLabel(), and Swap().

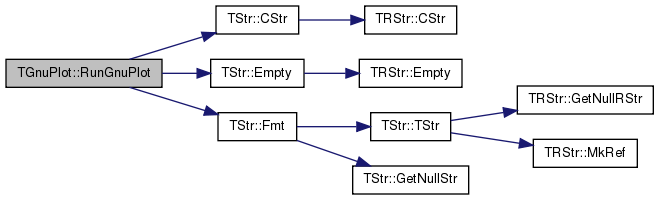
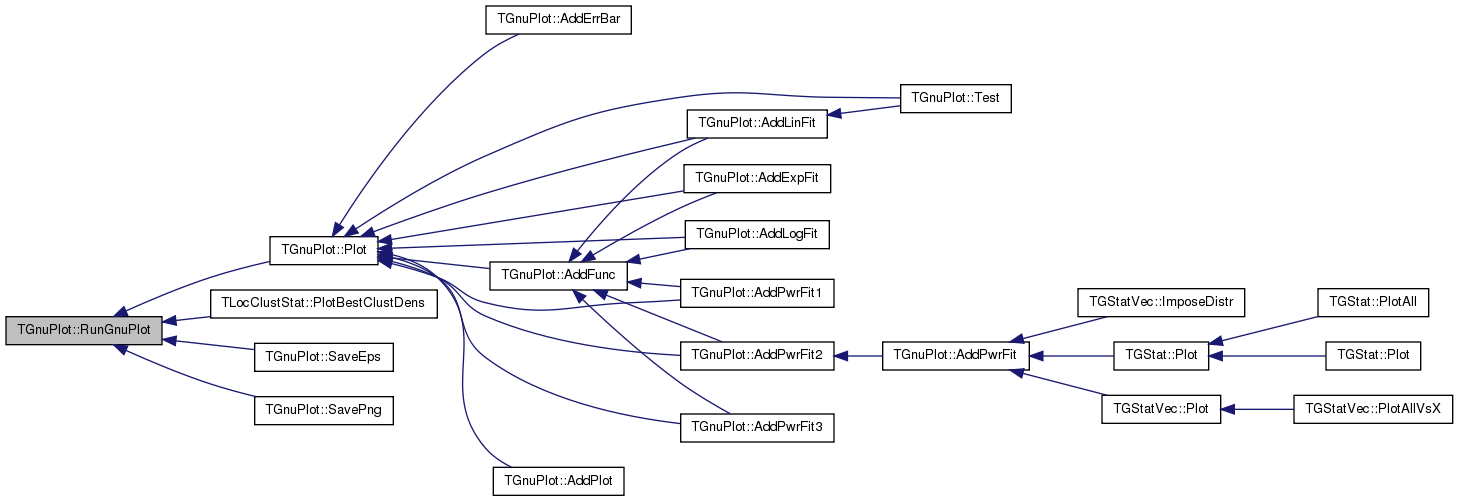
| void TGnuPlot::RunGnuPlot | ( | ) | const |
Definition at line 873 of file gnuplot.cpp.
References TStr::CStr(), TStr::Empty(), TStr::Fmt(), GnuPlotFNm, GnuPlotPath, and PlotFNm.
Referenced by Plot(), TLocClustStat::PlotBestClustDens(), SaveEps(), and SavePng().
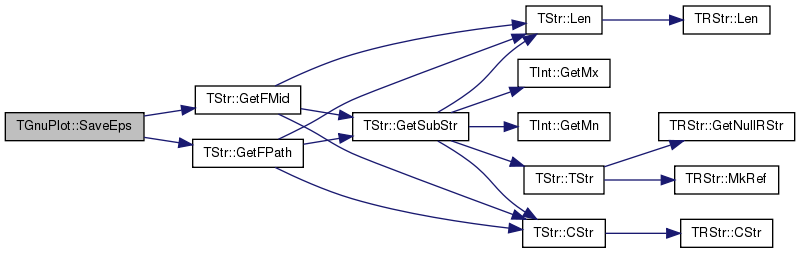
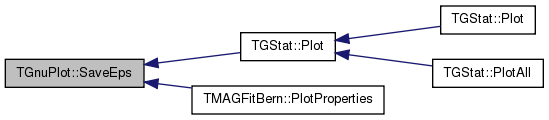
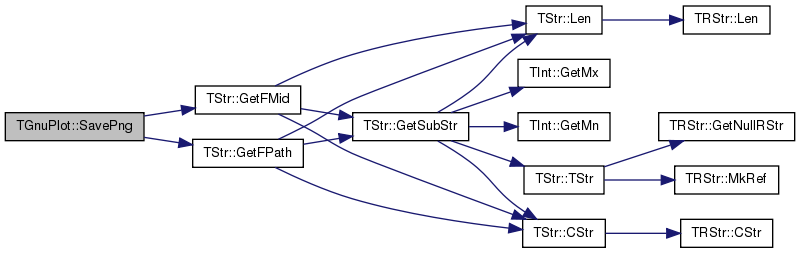
Definition at line 123 of file gnuplot.h.
References TStr::GetFMid(), and TStr::GetFPath().
Referenced by TGStat::Plot(), and TMAGFitBern::PlotProperties().
Definition at line 604 of file gnuplot.cpp.
References AddCmd(), CreatePlotFile(), TStr::CStr(), TVec< TVal, TSizeTy >::DelLast(), TStr::Empty(), TStr::Fmt(), MoreCmds, Pause(), RunGnuPlot(), and Title.

|
inline |
Definition at line 120 of file gnuplot.h.
References TStr::GetFMid(), and TStr::GetFPath().
Referenced by TNcpGraphsBase::Impose(), TGStatVec::ImposeDistr(), TLocClustStat::ImposeNCP(), TGStat::Plot(), TGStatVec::Plot(), PlotAutoCorrelation(), TLocClustStat::PlotBestClustDens(), TLocClustStat::PlotBoltzmanCurve(), TSnap::PlotClustCf(), TLocClust::PlotCutDistr(), TTimeNet::PlotEffDiam(), TTimeNENet::PlotEffDiam(), TForestFire::PlotFire(), TFfGGen::PlotFireSize(), PlotGrad(), TSnap::PlotHops(), TLocClustStat::PlotNCP(), TLocClustStat::PlotNCPModul(), TLocClustStat::PlotNCPScatter(), TLocClustStat::PlotNcpTop10(), TLocClust::PlotPhiDistr(), TLocClustStat::PlotPhiInOut(), PlotValCntH(), PlotValMomH(), PlotValOverTm(), PlotValV(), TLocClust::PlotVolDistr(), TAGMFit::RunMCMC(), TNetInfBs::SaveObjInfo(), Test(), TKroneckerLL::TestBicCriterion(), and TKroneckerLL::TestGradDescent().
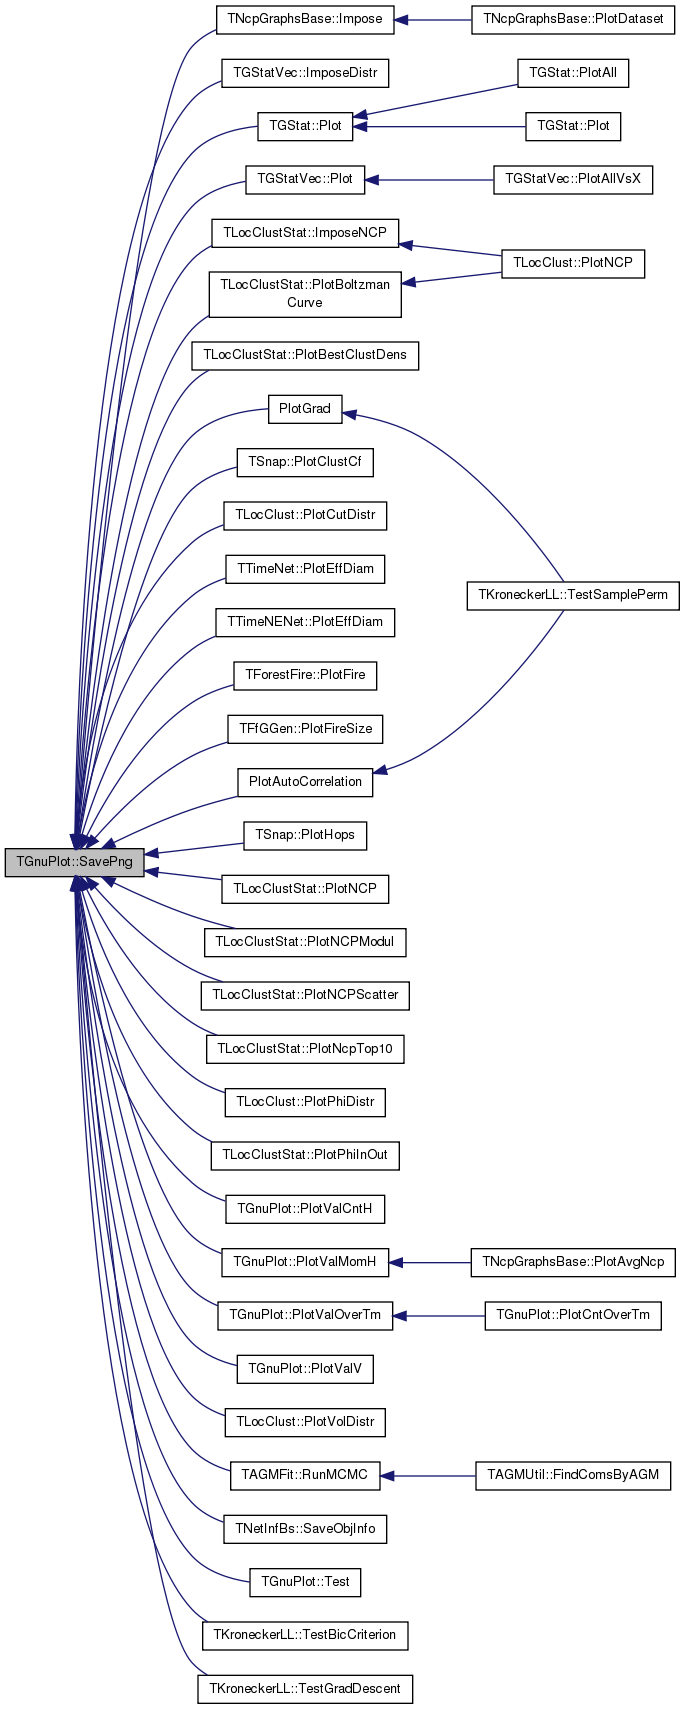
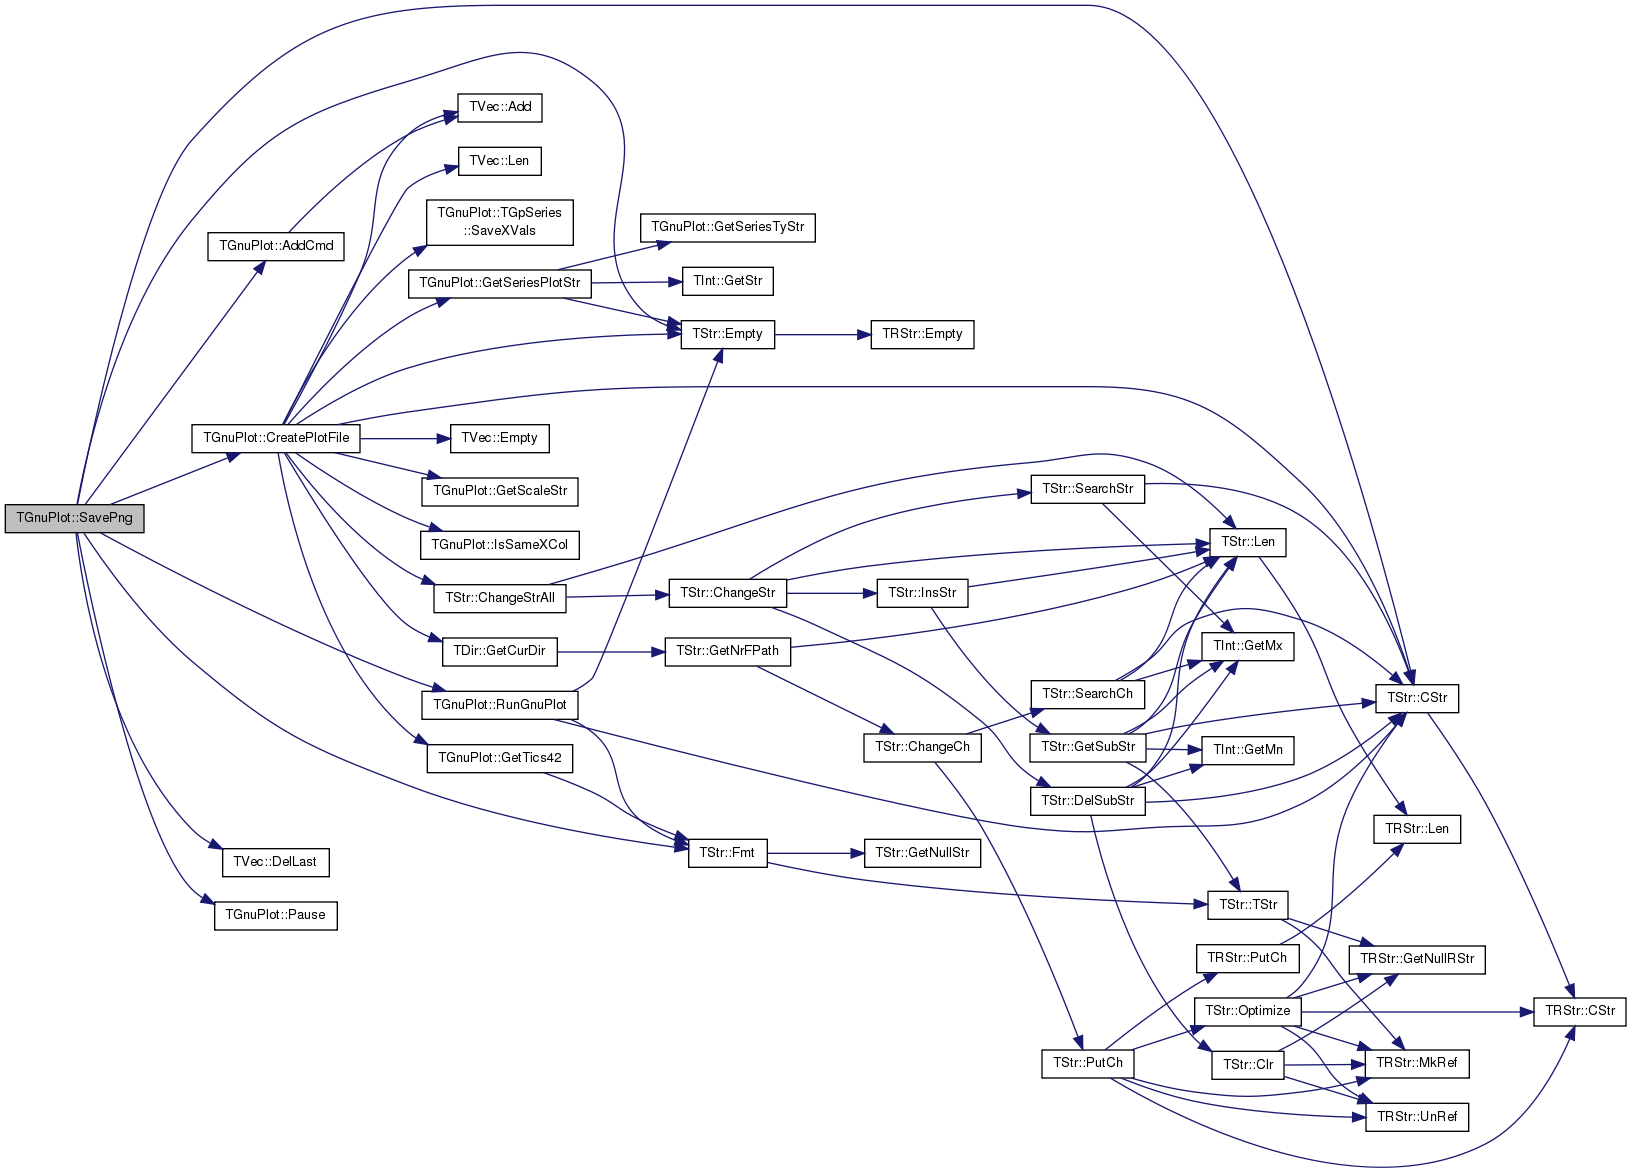
| void TGnuPlot::SavePng | ( | const TStr & | FNm, |
| const int & | SizeX = 1000, |
||
| const int & | SizeY = 800, |
||
| const TStr & | Comment = TStr(), |
||
| const TStr & | Terminal = TStr() |
||
| ) |
Definition at line 582 of file gnuplot.cpp.
References AddCmd(), CreatePlotFile(), TStr::CStr(), TVec< TVal, TSizeTy >::DelLast(), TStr::Empty(), TStr::Fmt(), MoreCmds, Pause(), RunGnuPlot(), and Title.
|
static |
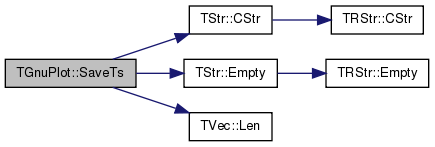
Definition at line 717 of file gnuplot.cpp.
References TStr::CStr(), EAssert, TStr::Empty(), and TVec< TVal, TSizeTy >::Len().
Referenced by TTimeNet::PlotCCfOverTm().
|
static |
Definition at line 727 of file gnuplot.cpp.
References TStr::CStr(), EAssert, TStr::Empty(), and TVec< TVal, TSizeTy >::Len().

|
static |
Definition at line 226 of file gnuplot.h.
References TStr::CStr(), EAssert, and TStr::Empty().
|
static |
Definition at line 236 of file gnuplot.h.
References TStr::CStr(), EAssert, and TStr::Empty().

|
static |
Definition at line 246 of file gnuplot.h.
References TStr::CStr(), EAssert, and TStr::Empty().

Definition at line 74 of file gnuplot.h.
Referenced by TAGMFit::RunMCMC().

|
inline |
|
inline |
Definition at line 78 of file gnuplot.h.
Referenced by TNcpGraphsBase::Impose(), TGStatVec::ImposeDistr(), TLocClustStat::ImposeNCP(), TGStat::Plot(), TGStatVec::Plot(), TLocClustStat::PlotBestClustDens(), TLocClustStat::PlotBoltzmanCurve(), TSnap::PlotClustCf(), TSnap::PlotHops(), TLocClustStat::PlotNCP(), TLocClustStat::PlotNCPModul(), TLocClustStat::PlotNCPScatter(), TLocClustStat::PlotNcpTop10(), TLocClustStat::PlotPhiInOut(), TMAGFitBern::PlotProperties(), PlotValCntH(), PlotValMomH(), PlotValOverTm(), and PlotValV().
|
inline |
Definition at line 70 of file gnuplot.h.
Referenced by TAGMFit::RunMCMC().

|
inline |
Definition at line 79 of file gnuplot.h.
Referenced by TLocClustStat::ImposeNCP(), TLocClustStat::PlotNCP(), TLocClustStat::PlotNCPModul(), TLocClustStat::PlotNCPScatter(), TLocClustStat::PlotNcpTop10(), and TLocClustStat::PlotPhiInOut().
Definition at line 73 of file gnuplot.h.
Referenced by TGStatVec::ImposeDistr(), TLocClustStat::ImposeNCP(), TGStat::Plot(), TGStatVec::Plot(), PlotAutoCorrelation(), TLocClustStat::PlotBestClustDens(), TLocClustStat::PlotBoltzmanCurve(), TSnap::PlotClustCf(), TLocClust::PlotCutDistr(), TTimeNet::PlotEffDiam(), TTimeNENet::PlotEffDiam(), TForestFire::PlotFire(), TFfGGen::PlotFireSize(), PlotGrad(), TSnap::PlotHops(), TLocClustStat::PlotNCP(), TLocClustStat::PlotNCPModul(), TLocClustStat::PlotNCPScatter(), TLocClustStat::PlotNcpTop10(), TLocClust::PlotPhiDistr(), TLocClustStat::PlotPhiInOut(), TMAGFitBern::PlotProperties(), PlotValCntH(), PlotValMomH(), PlotValOverTm(), PlotValV(), TLocClust::PlotVolDistr(), Test(), TKroneckerLL::TestBicCriterion(), and TKroneckerLL::TestGradDescent().
|
inline |
Definition at line 80 of file gnuplot.h.
Referenced by PlotGrad().

|
inline |
Definition at line 76 of file gnuplot.h.
Referenced by TMAGFitBern::PlotProperties().

|
static |
Definition at line 736 of file gnuplot.cpp.
References TVec< TVal, TSizeTy >::Add(), AddErrBar(), AddLinFit(), AddPlot(), gpwLines, gpwPoints, Plot(), TInt::Rnd, SavePng(), and SetXYLabel().
|
private |
Definition at line 50 of file gnuplot.h.
Referenced by AddErrBar(), AddPlot(), CreatePlotFile(), TGnuPlot::TGpSeries::operator=(), operator=(), and PlotValOverTm().
|
static |
GnuPlot executable file name. Set if different than the standard wgnuplot/gnuplot.
Definition at line 21 of file gnuplot.h.
Referenced by RunGnuPlot().
|
static |
Path to GnuPlot executable. Set if gnuplot is not found in the PATH.
Definition at line 19 of file gnuplot.h.
Referenced by RunGnuPlot().
|
private |
Definition at line 51 of file gnuplot.h.
Referenced by CreatePlotFile(), and operator=().
|
private |
Definition at line 51 of file gnuplot.h.
Referenced by CreatePlotFile(), and operator=().
|
private |
Definition at line 56 of file gnuplot.h.
Referenced by CreatePlotFile(), operator=(), SaveEps(), and SavePng().
|
private |
Definition at line 50 of file gnuplot.h.
Referenced by CreatePlotFile(), operator=(), and RunGnuPlot().
|
private |
Definition at line 52 of file gnuplot.h.
Referenced by CreatePlotFile(), and operator=().
Definition at line 55 of file gnuplot.h.
Referenced by AddErrBar(), AddExpFit(), AddFunc(), AddLinFit(), AddLogFit(), AddPlot(), AddPwrFit1(), AddPwrFit2(), AddPwrFit3(), CreatePlotFile(), GetSeriesPlotStr(), IsSameXCol(), and operator=().
|
private |
Definition at line 54 of file gnuplot.h.
Referenced by CreatePlotFile(), and operator=().
|
private |
Definition at line 54 of file gnuplot.h.
Referenced by CreatePlotFile(), and operator=().
|
staticprivate |
Definition at line 48 of file gnuplot.h.
Referenced by CreatePlotFile().
|
private |
Definition at line 51 of file gnuplot.h.
Referenced by AddErrBar(), AddPlot(), CreatePlotFile(), operator=(), SaveEps(), and SavePng().
|
private |
Definition at line 53 of file gnuplot.h.
Referenced by CreatePlotFile(), and operator=().
|
private |
Definition at line 53 of file gnuplot.h.
Referenced by CreatePlotFile(), and operator=().
 1.8.10