|
SNAP Library 6.0, Developer Reference
2020-12-09 16:24:20
SNAP, a general purpose, high performance system for analysis and manipulation of large networks
|
|
SNAP Library 6.0, Developer Reference
2020-12-09 16:24:20
SNAP, a general purpose, high performance system for analysis and manipulation of large networks
|

Go to the source code of this file.
Functions | |
| void | GetMinMax (const TFltPrV &XYValV, double &Min, double &Max, const bool &ResetMinMax) |
| void | PlotGrad (const TFltPrV &EstLLV, const TFltPrV &TrueLLV, const TVec< TFltPrV > &GradVV, const TFltPrV &AcceptV, const TStr &OutFNm, const TStr &Desc) |
| void | PlotAutoCorrelation (const TFltV &ValV, const int &MaxK, const TStr &OutFNm, const TStr &Desc) |
| void | McMcGetAvgAvg (const TFltV &AvgJV, double &AvgAvg) |
| void | McMcGetAvgJ (const TVec< TFltV > &ChainLLV, TFltV &AvgJV) |
| void | PlotTrueAndEst (const TStr &OutFNm, const TStr &Desc, const TStr &YLabel, const TFltPrV &EstV, const TFltPrV &TrueV) |
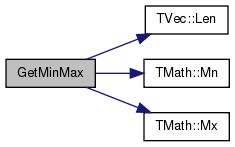
| void GetMinMax | ( | const TFltPrV & | XYValV, |
| double & | Min, | ||
| double & | Max, | ||
| const bool & | ResetMinMax | ||
| ) |
Definition at line 1732 of file kronecker.cpp.
References TVec< TVal, TSizeTy >::Len(), TMath::Mn(), TFlt::Mn, TMath::Mx(), and TFlt::Mx.
Referenced by PlotGrad().

| void McMcGetAvgAvg | ( | const TFltV & | AvgJV, |
| double & | AvgAvg | ||
| ) |
Definition at line 1876 of file kronecker.cpp.
References TVec< TVal, TSizeTy >::Len().
Referenced by TKroneckerLL::CalcChainR2().


Definition at line 1883 of file kronecker.cpp.
References TVec< TVal, TSizeTy >::Add(), and TVec< TVal, TSizeTy >::Len().
Referenced by TKroneckerLL::CalcChainR2().


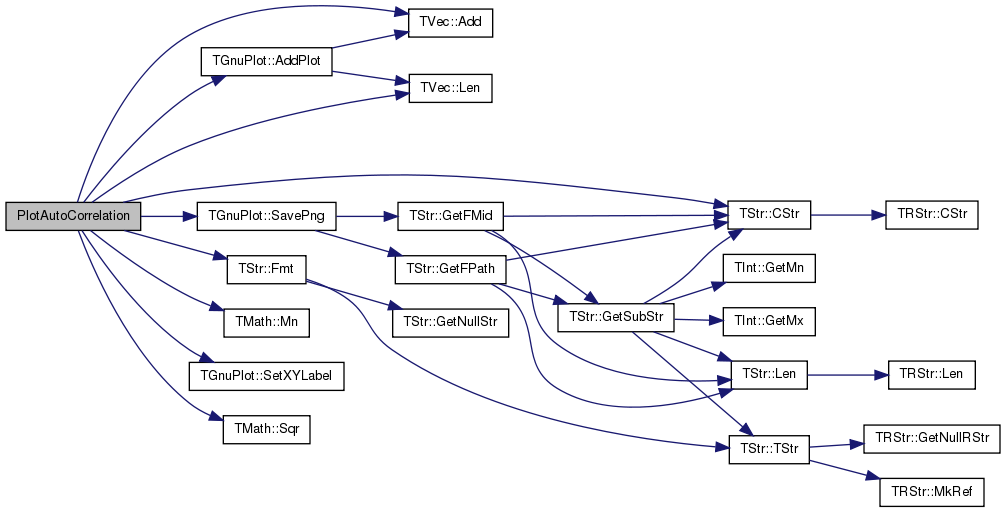
| void PlotAutoCorrelation | ( | const TFltV & | ValV, |
| const int & | MaxK, | ||
| const TStr & | OutFNm, | ||
| const TStr & | Desc | ||
| ) |
Definition at line 1773 of file kronecker.cpp.
References TVec< TVal, TSizeTy >::Add(), TGnuPlot::AddPlot(), TStr::CStr(), TStr::Fmt(), gpwLines, TVec< TVal, TSizeTy >::Len(), TMath::Mn(), TGnuPlot::SavePng(), TGnuPlot::SetXYLabel(), and TMath::Sqr().
Referenced by TKroneckerLL::TestSamplePerm().

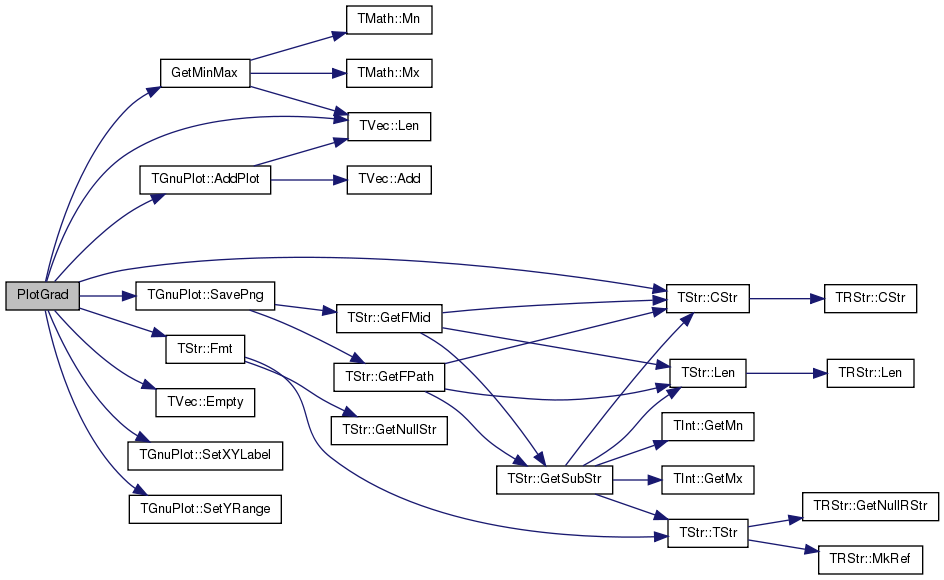
| void PlotGrad | ( | const TFltPrV & | EstLLV, |
| const TFltPrV & | TrueLLV, | ||
| const TVec< TFltPrV > & | GradVV, | ||
| const TFltPrV & | AcceptV, | ||
| const TStr & | OutFNm, | ||
| const TStr & | Desc | ||
| ) |
Definition at line 1740 of file kronecker.cpp.
References TGnuPlot::AddPlot(), TStr::CStr(), TVec< TVal, TSizeTy >::Empty(), TStr::Fmt(), GetMinMax(), gpwLines, TVec< TVal, TSizeTy >::Len(), TGnuPlot::SavePng(), TGnuPlot::SetXYLabel(), and TGnuPlot::SetYRange().
Referenced by TKroneckerLL::TestSamplePerm().
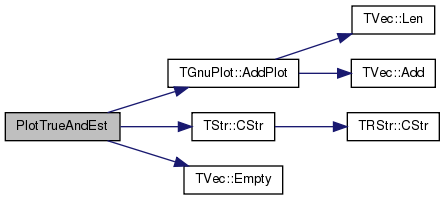
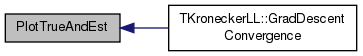
| void PlotTrueAndEst | ( | const TStr & | OutFNm, |
| const TStr & | Desc, | ||
| const TStr & | YLabel, | ||
| const TFltPrV & | EstV, | ||
| const TFltPrV & | TrueV | ||
| ) |
Definition at line 2009 of file kronecker.cpp.
References TGnuPlot::AddPlot(), TStr::CStr(), TVec< TVal, TSizeTy >::Empty(), gpwLines, and gpwLinesPoints.
Referenced by TKroneckerLL::GradDescentConvergence().
 1.8.10
